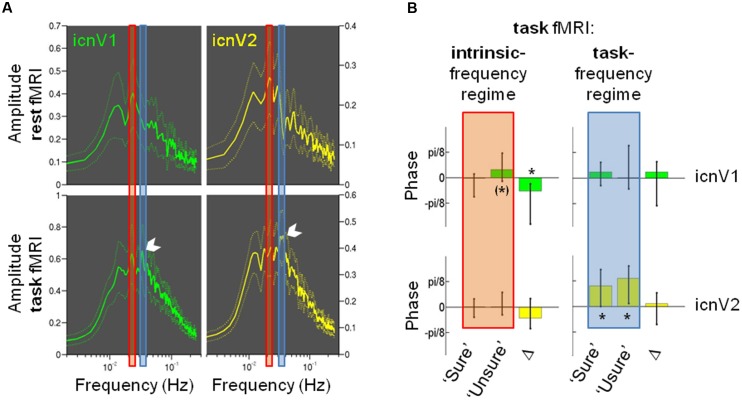
FIGURE 6.
The relevance of signal phases for visual consciousness. (A) Amplitude spectra as mean and standard error of the mean for ipsi-lateral icnV1 (green) and ipsi-lateral icnV2 (yellow), calculated from the whole-brain resting-state run (upper panels) and the task runs (lower panels). The peak corresponding to the task stimulation frequency is highlighted in the lower panels by a white arrow. Also highlighted are the regimes of intrinsic frequency (red) and task frequency (blue), which were used for further calculations of frequency-specific phases. (B) Phase values (median and 50% confidence intervals) prior to target presentation in the task runs for ipsi-lateral icnV1 (green) and icnV2 (yellow), separately for each frequency regime (intrinsic: red, task: blue) and each consciousness category (‘Sure,’ ‘Unsure’). Δ illustrates the median and 50% confidence interval of the individual phase differences between consciousness categories. Phases φ range from -π to π and translate into signal by φ = 0 meaning signal peak and φ = π or -π meaning signal trough. Significant deviations from an average phase of zero and non-zero Δ are marked by ∗, trends by (∗).

