
FIGURE 4.
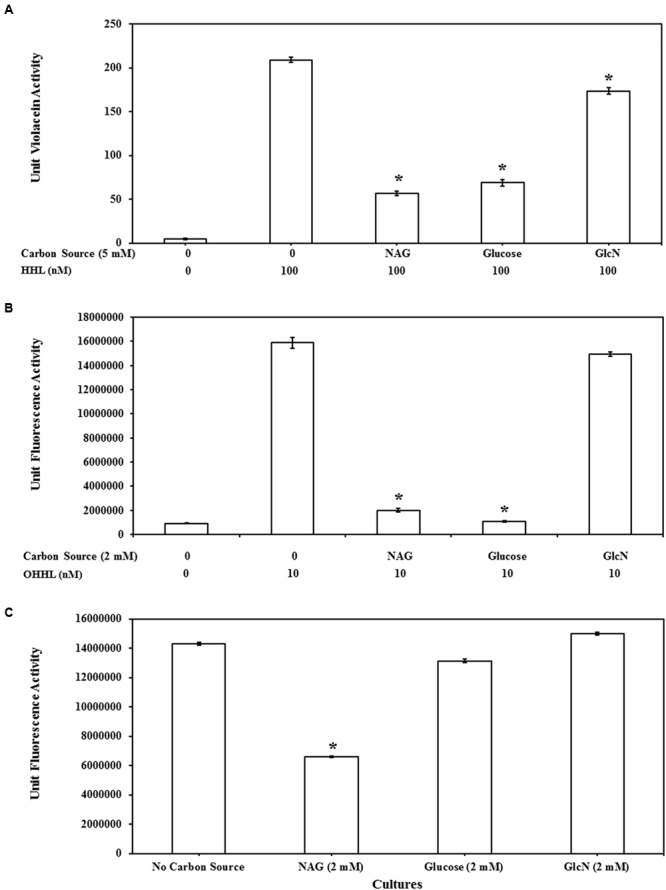
Comparison of QS inhibitory effects of NAG with glucosamine (GlcN) and glucose at 5 mM on (A) CviR dependent violacein production with exogenous addition of 100 nM HHL and violacein extraction after 20 h batch incubation, at 2 mM (B) LuxR dependent GFP production with exogenous addition of 10 nM OHHL and measurement of fluorescence at 20 h and (C) LasR dependent GFP production without exogenous AHL addition, fluorescence measurement 8 h. All cultures were in triplicate. Error bars represent standard deviation. Asterisks indicate the significant differences in comparison to control samples (P < 0.01).