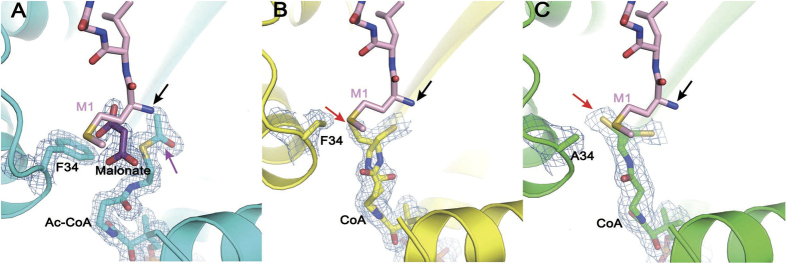
Figure 3. Electron density map of the active site.
The 2Fo-Fc maps contoured at 1.0σ are shown for hNaa60(1-242)/Ac-CoA (A), hNaa60(1-199)/CoA (B) and hNaa60(1-199) F34A/CoA (C). The putative substrate peptide binding site is indicated by the peptide (shown as pink sticks) from the hNaa50/CoA/peptide complex structure after superimposing hNaa50 on the hNaa60 structures determined in this study. The black arrow indicates the α-amine of the first Met (M1) (all panels). The purple arrow indicates the acetyl moiety of Ac-CoA (A). The red arrow indicates the alternative conformation of the thiol moiety of the co-enzyme when Phe 34 side-chain is displaced (B) or mutated to Ala (C).

