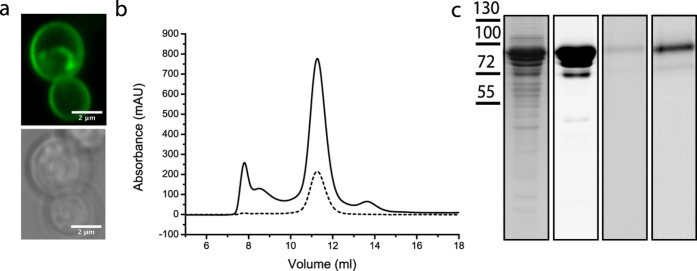
Figure 2. Expression and purification of Lyp1.
(a) Confocal imaging of Lyp1-TEV-GFP-His10 in P. pastoris showing fluorescence (top panel) and bright-field image (bottom panel). Scale bar is 2 μm. (b) Size-Exclusion Chromatography (SEC) profiles of Lyp1-GFP after Immobilized-Metal Affinity Chromatography (IMAC); continuous and dotted lines represent absorption at 280 nm and 488 nm, respectively. (c) Coomassie Blue staining and in-gel fluorescence imaging of purified Lyp1-GFP (lanes 1 and 2, respectively) and Lyp1-GFP proteoliposomes (lanes 3 and 4, respectively).

