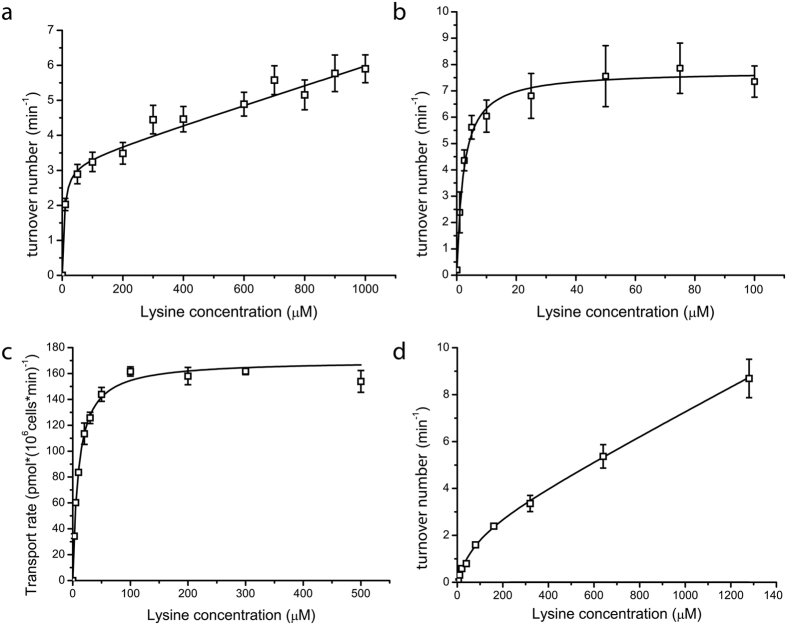
Figure 5. Kinetics of lysine transport.
(a) Lysine transport of membrane reconstituted Lyp1-GFP under a PMF: the data were fitted to a single hyperbola plus a linear component (R factor of 0.98), (b)) Lysine transport of membrane reconstituted LysP under a PMF: the data were fitted to a single hyperbola (R factor of 0.96). (c) Transport of lysine by Lyp1-YPet expressed in 22∆6AAL yeast5 from a plasmid and under the control of the endogenous lyp1 promoter and fit to a single hyperbola (R factor of 0.99). (d) Kinetics of lysine transport by membrane-reconstituted Lyp1-GFP under counterflow conditions. Counterflow was assayed with a an internal lysine concentration of 50 mM; higher internal concentrations of lysine could not be tested as they affected liposome formation. The data were fitted to a single hyperbola plus a linear component (R factor of 0.98). The rate of lysine transport (pmol*(106cells*min)−1) (panel c) or turnover number (min−1) (panels a, b and d) are plotted as a function of the external lysine concentration. All fits and errors are derived from three independent experiments.

