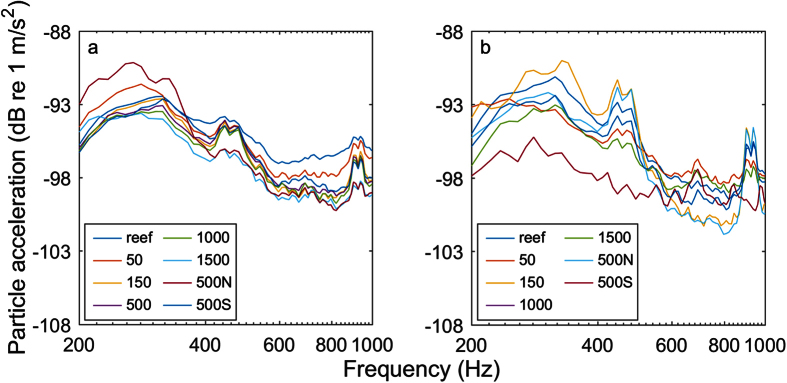
Figure 4. Mean particle acceleration values by transect, position, and frequency in the x-axis.
Peaks in acceleration were seen below 500 Hz in both transects, but no clear pattern with distance was evident. Acceleration was elevated slightly at the 500 N position during the dawn transect (a) and at the 150 m position during the mid-morning transect (b). No data were available for the 500 m position during the mid-morning transect.

