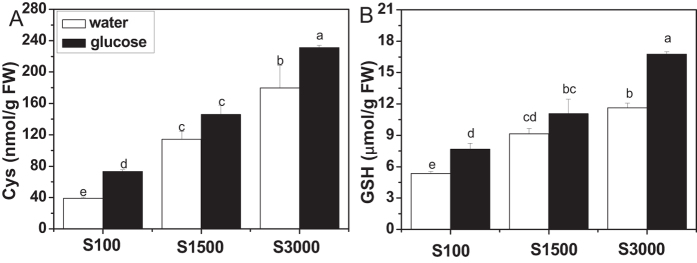
Figure 8. Cys and GSH contents in glucose-treated seedlings grown at different concentrations of sulfate.
Arabidopsis seedlings (wild type Col-0) were cultured at different concentrations of sulfate for 10 days and then treated with 3% glucose. The whole plants were harvested 3 days after treatment, and then cysteine and GSH contents were measured. Each data point represents the mean of five independent biological replicates per treatment (mean ± standard error). Values not sharing a common letter are significantly different at P < 0.05.

