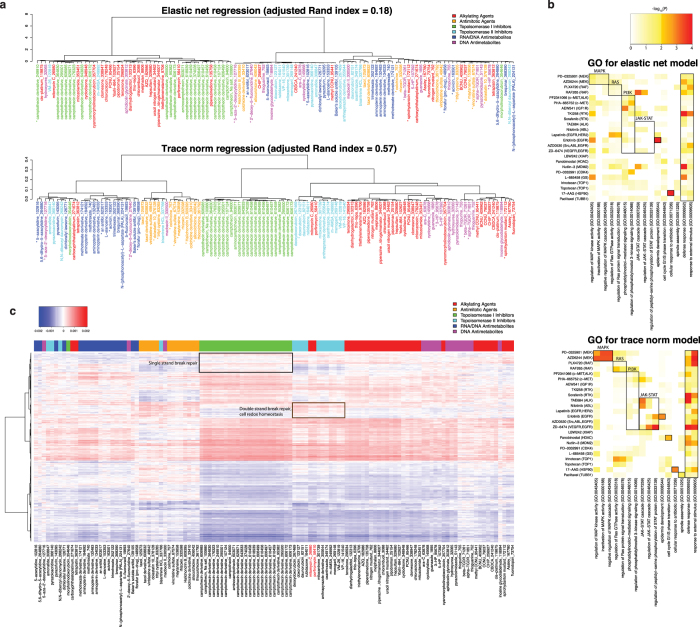
Figure 4. Trace norm drug prediction models capture information about drug mechanism of action.
(a) Hierarchical clustering elastic net model and trace norm model vectors on the NCI60 data set. Drugs with high label noise (P > 0.01) are marked with an asterisk. (b) Heatmaps of gene ontology (GO) enrichment analysis for top weighted genes in the elastic net and trace norm models. GO enrichment analysis was performed on the 100 highest-weighted features in the trace norm and elastic net weight vectors, and P values for the hypergeometric enrichment tests for selected pathways are shown in the heatmap (−log10P values are plotted). Known drug-pathway associations are shown in black boxes (e.g. PD0325901 and AZD6244 are MEK inhibitors and are known to disrupt the MAP kinase pathway). Significant P values (P < 0.01) are colored orange/red whereas insignificant ones are shown in white/yellow. (c) Heatmap of weight vectors learned by trace norm on the NCI60 data set. Columns (drugs) are in the same order as (b). Genes in the black box are enriched for single-strand break repair, and genes in the brown box are enriched for double-strand break repair and cell redox homeostasis.

