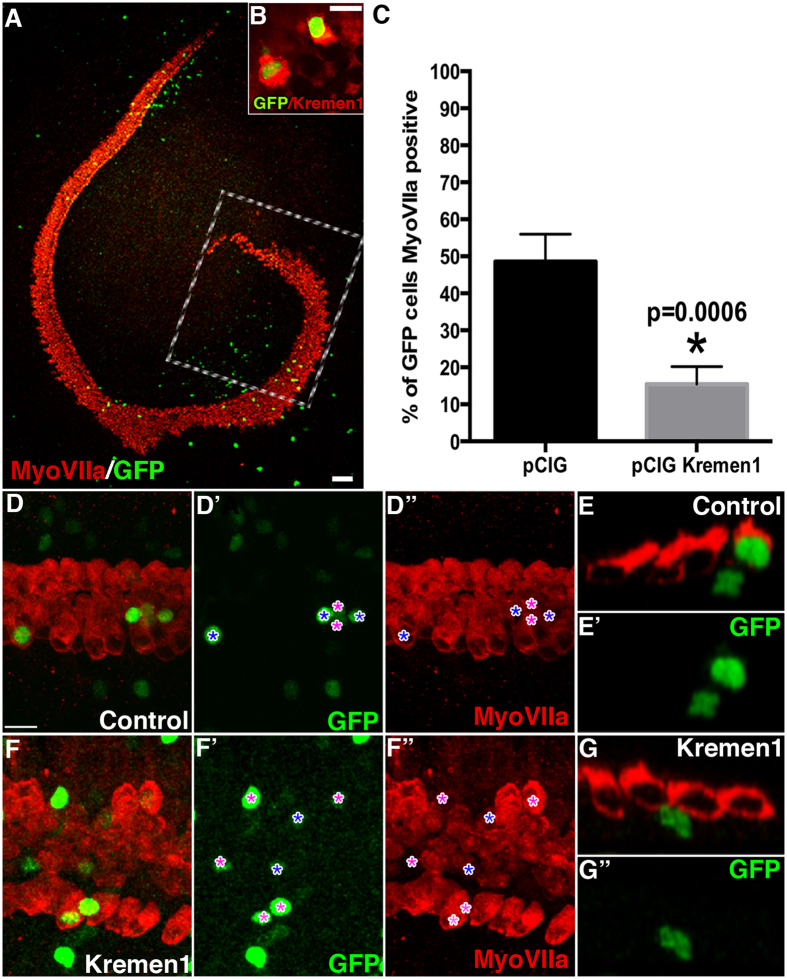
Figure 2. Kremen1 over expression had an antagonistic effect on hair cell fate.
(A) A low magnification view of a typical cochlear explant electroporated on E13.5 with a GFP transfection reporter (GFP). Explant cultures were established and electroporated on E13.5 and cultured in vitro for six days. Hair cells are labeled with antiMy oVIIa (red). Boxed region represents the apical portion of the duct where cells were quantified. Scale indicates 100 μm. (B) High magnification view of two cochlear cells transfected with pCIG.Kremen1.IRES.nucGFP (green) in the Kremen1 expressing region and stained by polyclonal anti Kremen1 (red), indicating that our expression construct generated robust levels of Kremen1. Scale indicates 10 μm. (C) Mean percentages of transfected cells that expressed MyoVIIa. Asterisk indicates p < 0.05. (D,D’,D”) High magnification surface view of apical region of a cochlear explant electroporated with empty vector. GFP positive cells are marked by asterisks (*) in blue if the GFP positive cell was colabeled by antiMyoVIIa, or purple if not. Scale indicates 20 μm. (E,E’) High magnification orthogonal view of a cochlear explant electroporated with empty vector. Two GFP positive cells are shown in close proximity within the sensory epithelium. One cell sits bellow the hair cell layer (in the supporting cell level) and one cell is colabelled with MyoVIIa. (F,F’,F”) High magnification surface view of apical region of a cochlear explant electroporated with pCIG.Kremen1.IRES.nucGFP. GFP positive cells are marked by asterisks (*) as in (D). (G) High magnification orthogonal view of a cochlear explant electroporated with pCIG.Kremen1.IRES.nucGFP.

