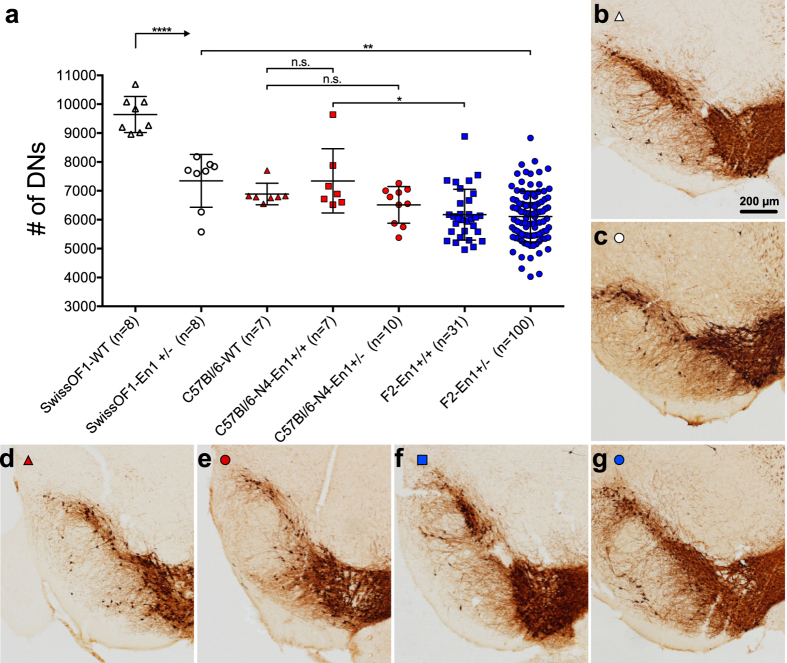
Figure 1. Neurodegeneration of TH-positive neurons in SNpc of the different mouse strains and intercrosses.
(a) Stereological quantification of DNs in SNpc at 17 weeks of age. Individual data points and the mean +/− S.D. are shown. The mean number of DNs in SwissOF1-wt was significantly higher than in all other groups; ****p < 0.0001, **p < 0.01, *p < 0.05. C57Bl/6-N4 mice have in average 97% C57Bl/6 background genome. Representative images used for stereological quantification with TH-positive staining in SNpc of SwissOF1 wt(b), SwissOF1-En1+/− (c), C57Bl/6 wt (d), C57Bl/6-N4-En1+/− (e), F2-En1+/+ (f), F2-En1+/− (g). Scale bar: 200 μm.

