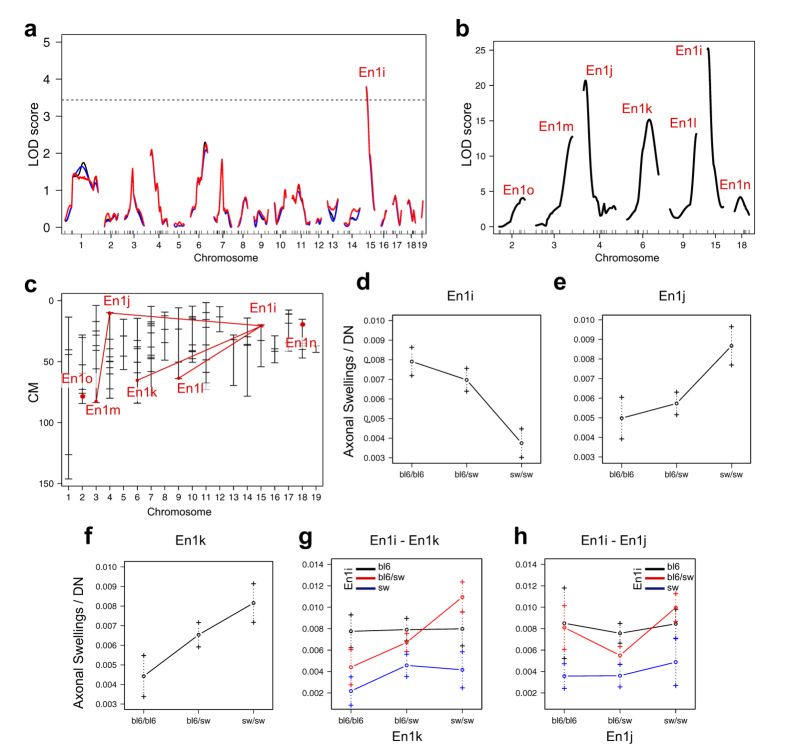
Figure 5. QTL analyses for the number of axonal swellings per number of remaing DNs.
(a) Single QTL analysis reveals one QTL at chromosome 15. Solid black - expectation-maximization; red - multiple imputation; blue - Haley-Knott; Dotted line - p = 0.05; (b) Multiple QTL analysis reveals 7 QTLs; (c) Refined positions of the 7 QTLs from multiple QTL scan. Lines between interacting loci; (d–f) Effect of En1i (d) En1j (e) and Enk (f) on axonal swellings per number of remaining DNs; (g) Interaction plot for En1i and En1k; (h) Interaction plot for En1i and En1j.

