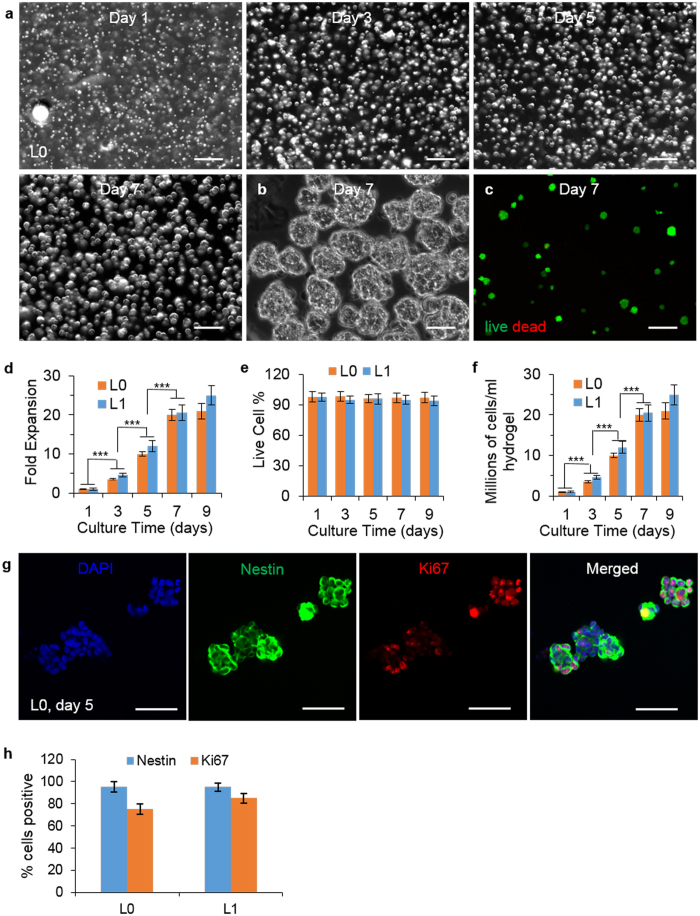
Figure 1. Culture glioblastoma TICs in 3D thermorevesible PNIPAAm-PEG hydrogel.
(a) Phase images showing L0 spheroids in the hydrogel on day 1, 3, 5, 7 of the culture. (b) Day 7 L0 spheroids released from the hydrogel (c) Live (green) and dead (red) staining of day 7 L0 spheroids. The fold of expansion (d) cell viability (e) and cell density (f) of L0 and L1 TICs in the hydrogel on day 1, 3, 5, 7 and 9 of the culture. (g) Immunostaining of day 5 L0 spheroids. (h) Percentage of Nestin+ and Ki67+ L0 and L1 TICs after 9 days culture in the hydrogel. Images were taken after spheroids were released from the hydrogel in (b,c,g). Error bars represent the standard deviation (n = 3). ***Indicates statistical significance at a level of p < 0.001. Scale bar: (a,c) 250 μm; (b,g) 50 μm.

