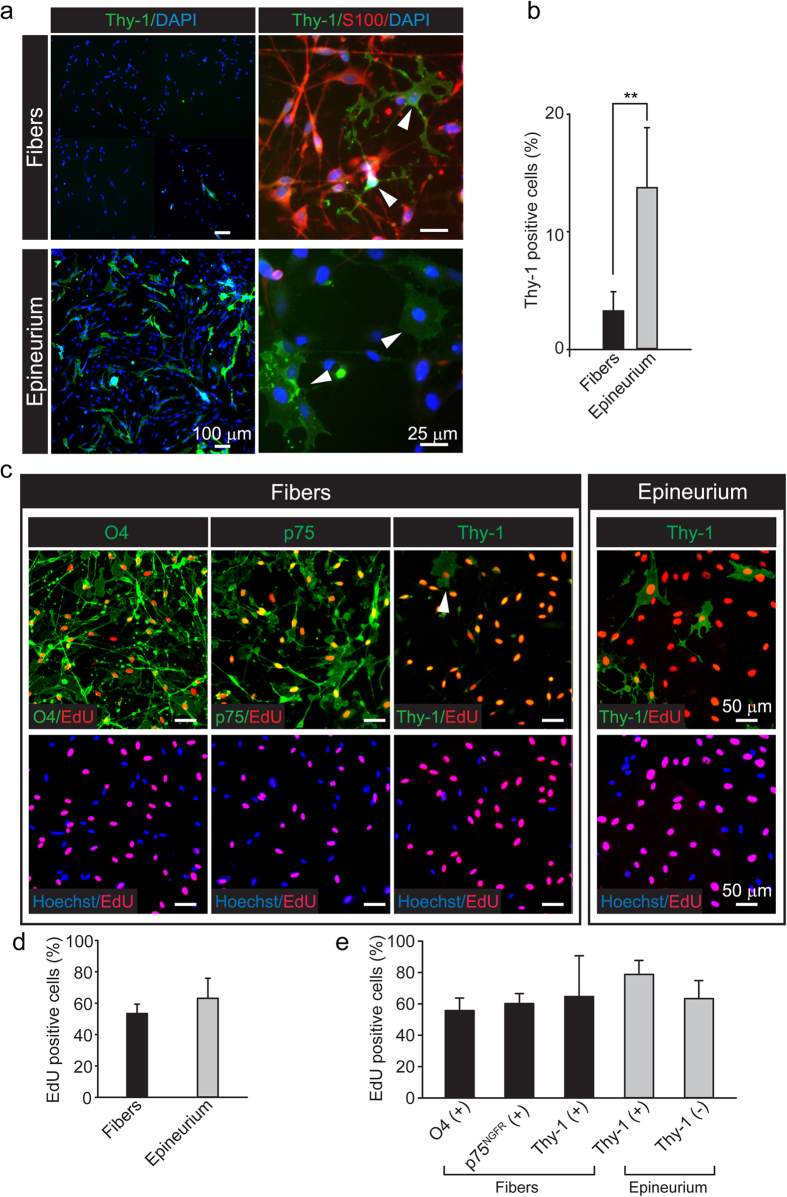
Figure 3. Proliferative capacity of the cell products from fibers and epineurium at 3 days post-plating.
(a,b) Fluorescence microscopy (a) and quantitative analysis (b) of Thy-1 expression in fiber- and epineurium-derived cultures (bars represent mean ± SD, **p < 0.01). A panoramic, low magnification view of the cultures is shown to reveal the extent of fibroblast contamination (left images). Higher magnification images (right images) of cultures double immuno-stained with Thy-1 and S100 antibodies are shown to confirm the specificity of labeling and the morphology of the cells in each preparation. Fibroblasts are indicated by arrowheads. (c,e) Fluorescence microscopy analysis of EdU incorporation along with immunostaining with O4, p75NGFR and Thy-1 antibodies. Representative images (c) and quantitative analysis (d,e) of cultures labelled with EdU (red) and the markers indicated in the figure (green) are provided. As shown by the graph displayed in panel (e), more than half of the isolated SCs were identified as actively proliferating cells (bars are shown as mean ± SD).

