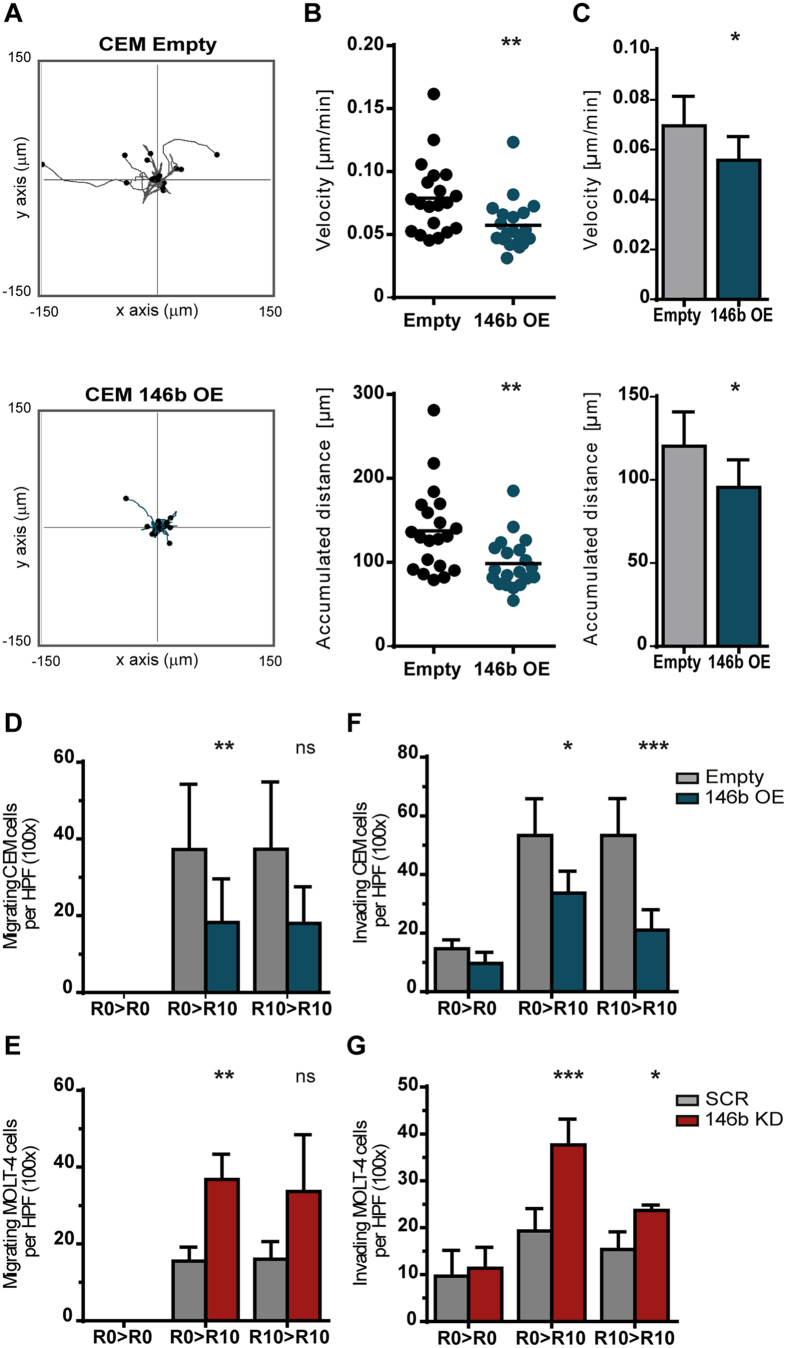
Figure 3. MiR-146b downregulates cell motility, migration and invasion of T-ALL cells.
CEM cells ectopically expressing miR-146b (146b OE) or mock-transduced (Empty) were compared; MOLT-4 cells with downregulation of miR-146b-5p (146b KD) or scramble-transduced (SCR) were compared. Statistical significance was calculated using paired two-tailed Student’s t-test (*p < 0.05; **p < 0.01; ***p < 0.001). (A) Migration of individual CEM cells (n = 20) was recorded for 30 min by time-lapse video microscopy. The flower plot diagrams are representative of ten independent experiments. The starting point of each track is placed at the axis origin. (B) Migration velocity (top) and accumulated traveled distance (bottom) of leukemic cells depicted in (A). Lines indicate mean values. (C) The mean velocity (top) and accumulated distance (bottom) of 20 individual leukemic cells was assessed in ten independent time-lapse experiments. The bar graphs represent the mean ± SD. (D–G) Migration (D,E) and invasion (F,G) were assessed through transwell and matrigel coated transwell assays, respectively. Serum was used as chemoattractant. Cells were plated on the upper chamber of the transwell in culture medium in the absence (R0) or presence of 10% serum (R10), as indicated: medium present in the upper chamber > medium in the lower chamber (R10). The number of cells was determined by counting five non-overlapping high-power fields (HPF×100) per transwell. At least three independent experiments were performed (in triplicate). Graphs represent mean ± SD number of cells per HPF counted in at least three independent migration experiments.

