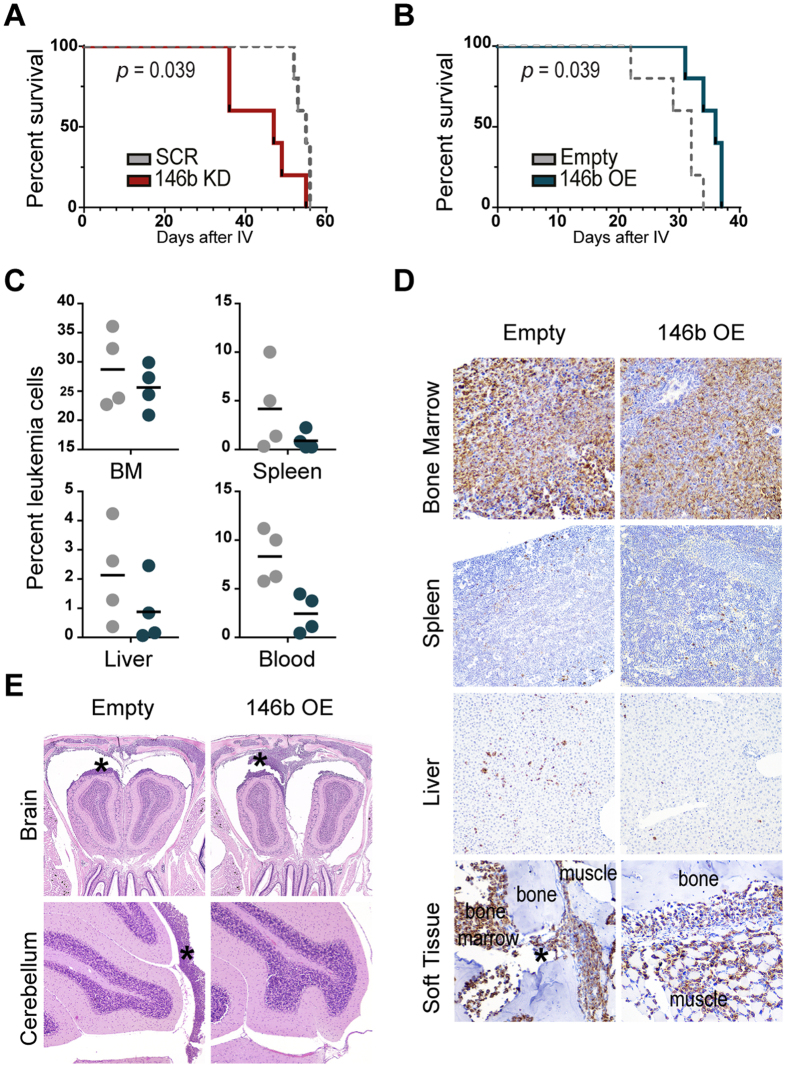
Figure 5. In vivo miR-146b-5p behaves as a tumor suppressor, with significant impact on T-ALL disease progression.
NOD/SCID mice were xenotransplanted either with MOLT-4 cells with miR-146b-5p downregulation (146b KD; red) versus scramble transduced cells (SCR; grey) or with CEM cells ectopically expressing miR-146b (146b OE; blue) versus empty vector-transduced cells (Empty; grey). (A,B) Kaplan-Meyer survival curves, with a median survival of (A) 47 days for 146b KD (n = 5) versus 55 days for SCR control (n = 5), and (B) of 36 days for 146b OE (n = 5) versus 32 days Empty control (n = 5) (p < 0.05 in both cases, log-rank test). (C–E) Leukemia infiltration into different organs was assessed in CEM-transplanted mice (n = 4 Empty; n = 4 146b OE) at day 25 post-injection. (C) Erythrocyte-free cell suspensions of each organ were analyzed by flow cytometry to detect the presence of leukemic (RFP+) cells. The lines indicate the average percentage. BM – Bone marrow. (D) Representative micrographs of the bone marrow, spleen, liver and soft tissue. Immunohistochemistry for human vimentin was used to identify minimal infiltration by leukemia cells. Infiltration in the soft tissue originated from direct invasion from the bone marrow through the bone foramina of vertebra (*), skull, mandibular bones. 3,3′-Diaminobenzidine counterstained with hematoxylin; size units in μm; original magnification 200× (bone marrow and soft tissue), 100× (liver and spleen). (E) Representative H&E micrographs of CNS – brain (olfactory bulb) and cerebellum. In both experimental groups CNS infiltration corresponded to leptomeningeal infiltration, with the formation of multifocal to diffuse solid tumor masses (*) and with decreased severity in CEM 146b OE mice in comparison with controls. Size units in μm; original magnification 25× (brain) and 50× (cerebellum).

