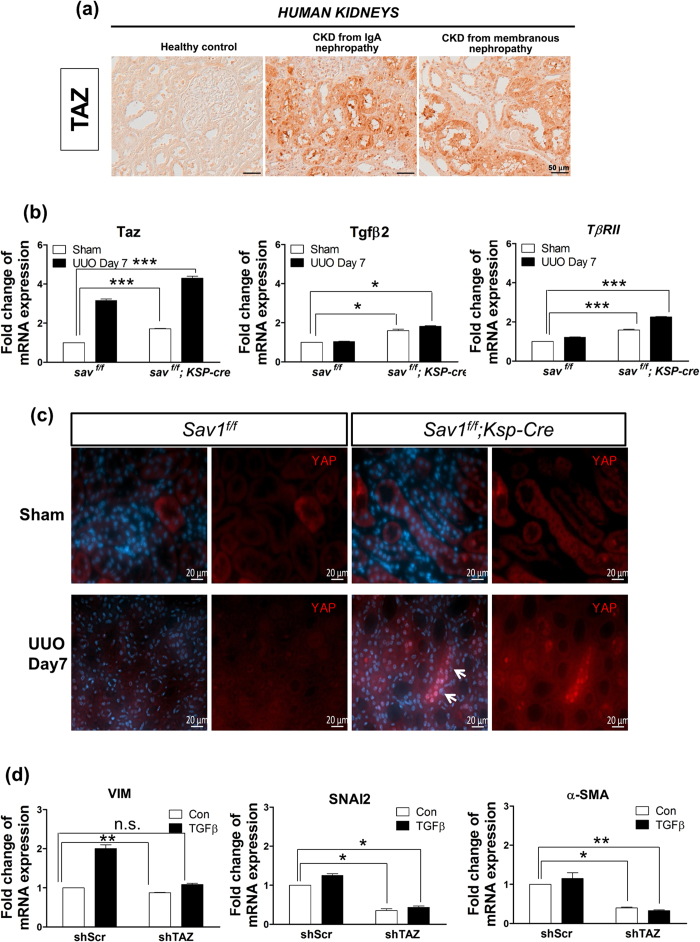
Figure 5. TAZ protein levels are increased in the kidneys of patients with CKD.
(a) Immunohistochemical staining for TAZ expression in the kidneys of a healthy control individual and of patients with biopsy-documented IgA nephropathy and membranous nephropathy. (b) Relative TAZ and TGF-β2 expression and TβRII transcript levels were measured in the kidneys of WT and TEC-specific Sav1-null mice after UUO using qRT-PCR. Sav1-null mice kidneys exhibited increased TAZ, TGF-βII, and TβRII mRNA expression. Error bars represent SEMs. *P < 0.05; **P < 0.01; ***P < 0.005 by paired t-test (one-tailed). P = 0.00043, 0.03991, 0.00254 (comparison between the 1st bar and 3rd bar) and 0.00048, 0.01366, 0.00024 (comparison between the 1st bar and 4th bar) for ANKRD1, CTGF and NEGR1, respectively. (c) Sav1 deficiency after UUO resulted in nuclear accumulation of YAP1. Immunofluorescence staining for YAP1 (Red) with anti-YAP1 antibodies in control and TEC-specific Sav1-null mice. YAP1 was strongly localized in the nuclei of SAV1-nul kidneys after UUO. (d) qRT-PCR analysis of the EMT markers VIM, SNAI2, and α-SMA in control and TAZ-knockdown HK2 cells during incubation with TGF-β1. TAZ knockdown reduced TGF-β1-induced EMT marker expression. Error bars represent SEMs. n.s., not significant; *P < 0.05; **P < 0.01 by paired t-test (one-tailed). Scale bar in a = 50 μm and c = 20 μm.

