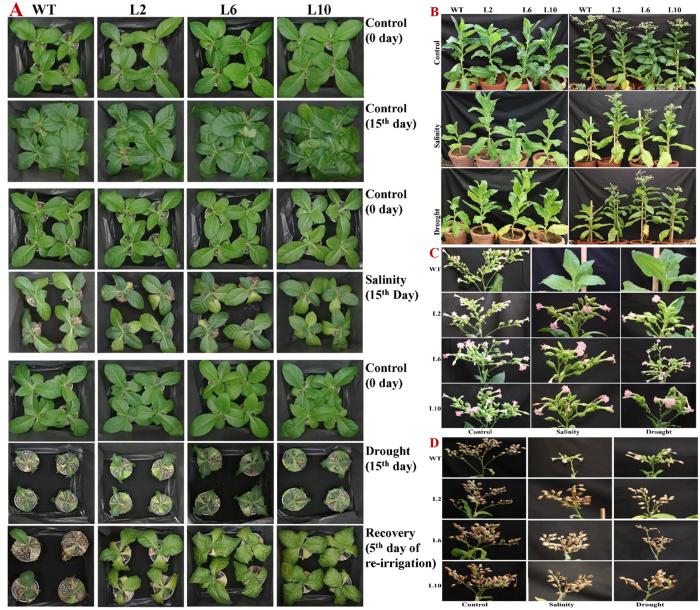
Figure 5. Comparative plant growth studies under salt and osmotic stress.
(A) Morphological studies; (B) life cycle study; (C) flowering stage, and (D) mature (seed) stage of WT and SbSDR1 transgenic plants at control and stress conditions. Plant images were documented as per stages of plants grown under control condition.

