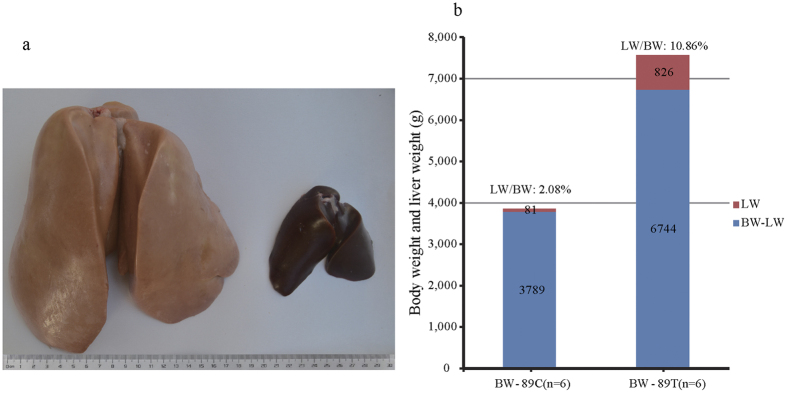
Figure 1. Body and liver weights were dramatically increased in the overfed vs. normally fed geese.
(a) Representative images of fatty liver from an overfed Landes goose (treatment or T group, on the left) compared to normal liver from a normally fed Landes goose (control or C group, on the right) at 89 days of age (or at day 19 of overfeeding). (b) Body weight (BW), liver weight (LW) and the ratio of LW to BW in the overfed and normally-fed Landes geese at day 19 of overfeeding. N = 6. The data were presented as the means ± SD.

