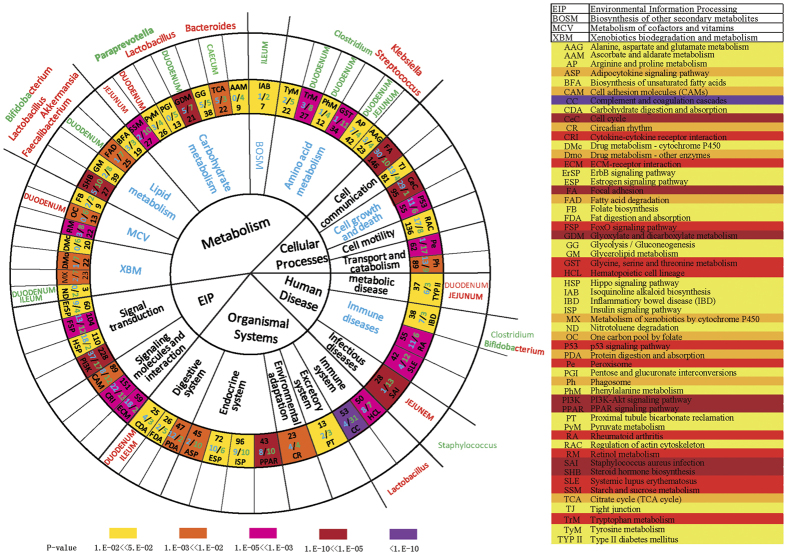
Figure 4. Intestinal microbes responded in synergy with the response of goose liver transcriptome to overfeeding.
The enriched KEGG pathways were revealed by the genes (DEGs) differentially expressed in the livers or the genes of microbes that differentially inhabited intestines of the overfed vs. normally fed geese at day 19 of overfeeding. The circles from the center outward denote the first-, second-, and third-tier KEGG pathways, respectively. The second-tier pathways in blue are statically significantly enriched. The abbreviated names of the pathways, the total numbers (in black) of genes in each pathway, and the numbers (in blue) of the upregulated/downregulated genes in the livers of the overfed vs normally-fed geese are denoted in the circle with the third-tier pathways. The background colors in this circle indicate the P-values for a given pathway (with color bar for the scale of P-values at the bottom). The circle with different intestinal segments indicates the genes of gut microbes shared the same pathways with the DEGs from liver transcriptome analysis. The names of intestinal segments in red or green denote the abundance of microbes were increased or decreased in the given intestinal segments, respectively. In the circle with microbial names, the microbes whose abundances were increased or decreased in the overfed vs normally-fed geese are denoted in red or green, respectively. The microbes in mixed color are those whose abundance was increased or decreased over different intestinal segments. The table on the right illustrates the abbreviated KEGG pathways.

