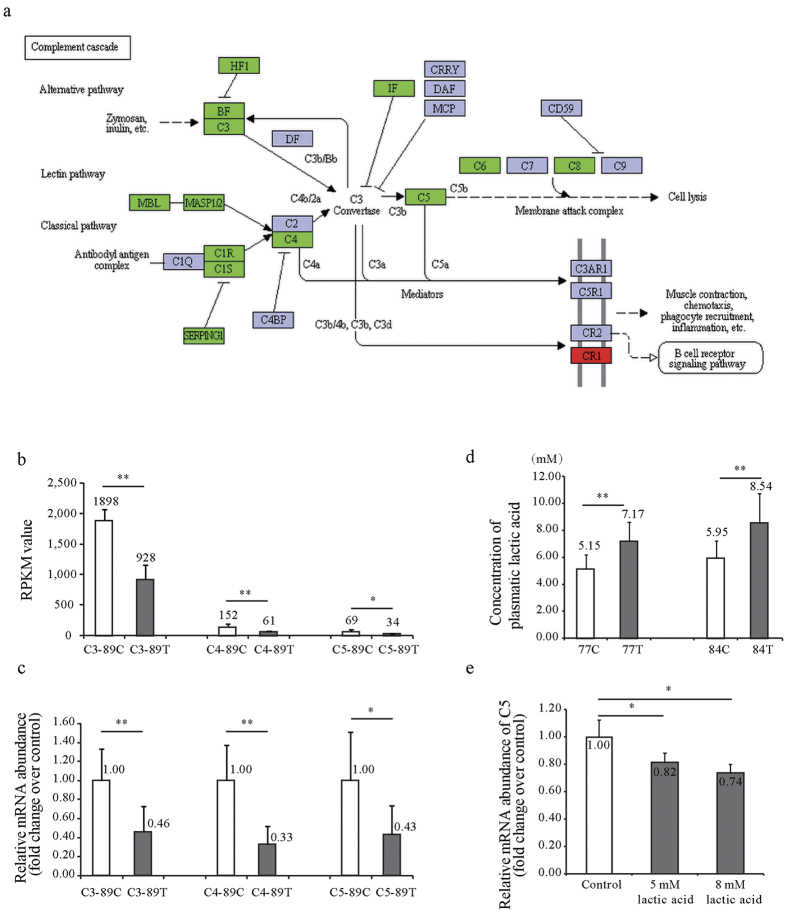
Figure 5. The suppression of the ‘Complement cascades’ pathway by lactic acid from intestinal Lactobacillus.
(a) The genes in the ‘Complement system’ KEGG pathway were differentially regulated in the livers of the overfed vs normally fed geese. The genes in red/green stand for those whose expressions were upregulated or downregulated by overfeeding. (b) The comparisons of C3, C4 and C5 expression in the livers of the overfed (the treatment or T group) and normally-fed geese (the control or C group) at day 19 of overfeeding. The data was from liver transcriptome analysis. N = 3. (c) The expression of C3, C4 and C5 genes in the livers of the overfed vs normally-fed geese at day 19 of overfeeding. The data was from quantitative real time PCR analysis. N = 6. (d) The concentrations of plasma lactic acid in the overfed vs normally fed geese at day 7 and 14 of overfeeding. N = 6. (e) The expression of C5 was determined by quantitative PCR in the goose primary hepatocytes treated with vs without lactic acid. N = 5. All the data are presented as the means ± SD.

