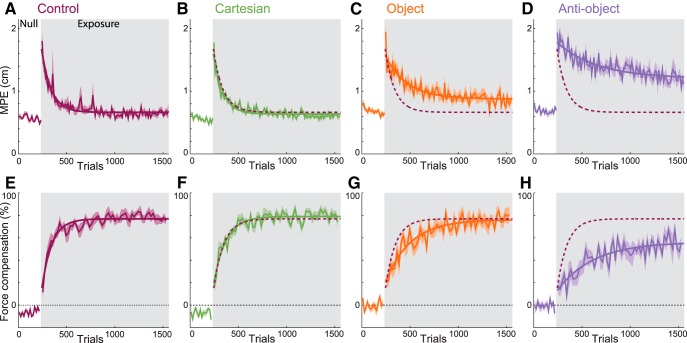
Figure 3.
Adaptation to the force fields. A–D, Maximum perpendicular error. E–H, Force compensation percentage for the four groups (mean and SE across subjects) with exponential fits. Blocks of 10 nonchannel trials were used for the MPE, while blocks of four channel trials were used for the force compensation. The gray shaded region indicates the exposure period. The dashed curves are the exponential fit to the control group for comparison.

