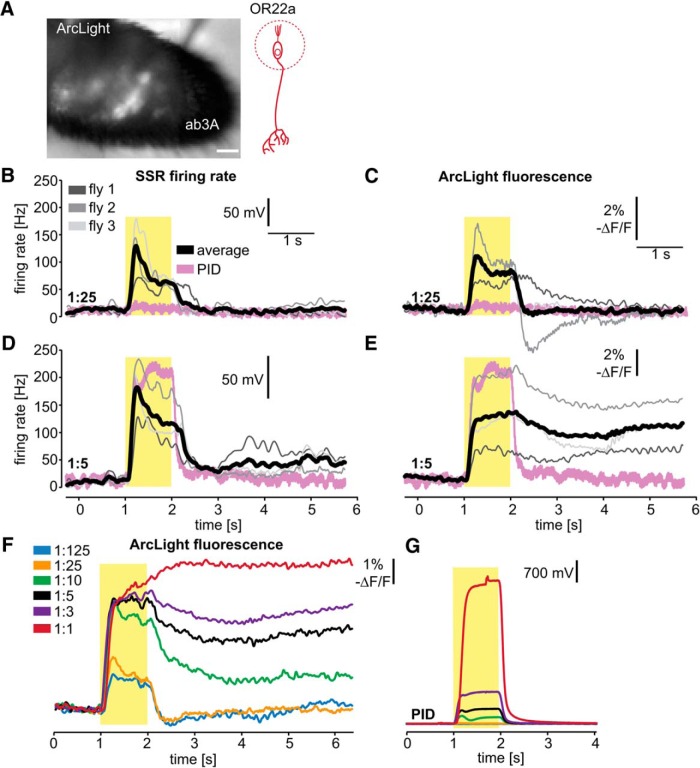
Figure 2.
Optical electrophysiology reveals sustained peripheral OSN responses. A, Combined fluorescent and transmitted light image of the antenna of a fly expressing ArcLight in OR22a-expressing OSNs. Scale bars, 20 µm. B–E, Simultaneous SSR of ab3 and voltage imaging of the antenna of three flies expressing ArcLight in OR22a-expressing OSNs. Representative PID signals are shown and were measured ∼2–4 mm behind the fly. Yellow boxes indicate odor pulse duration. F, Mean ArcLight signals (n = 4) in response to 1 s Eb pulses at the indicated gas-phase dilutions. G, Mean PID signals for the odor pulses in F, measured at the fly.

