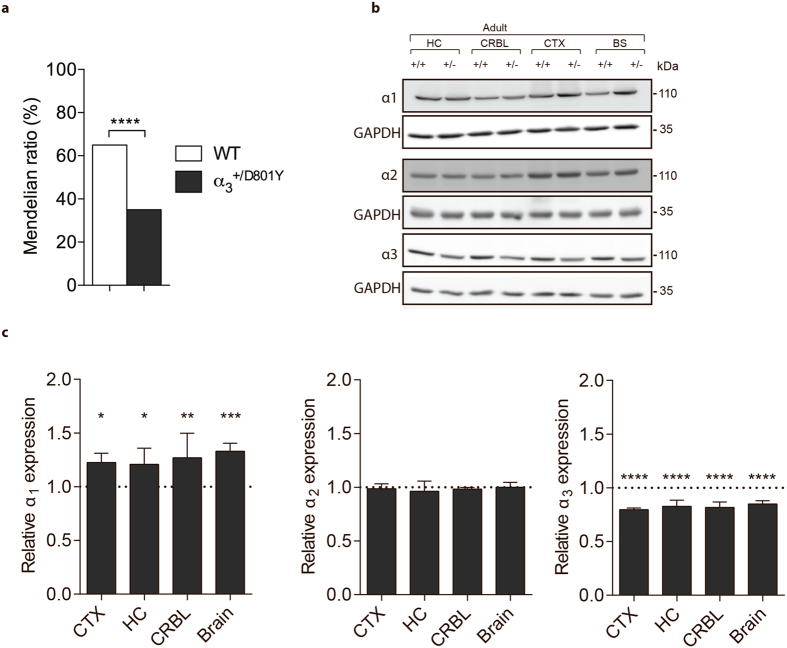
Figure 2. Basic characterization of the α3+/D801Y mice.
Boxplot showing skewed genotype ratio at weaning age (approximately postnatal day 21) (α3+/D801Y mice N = 70, WT mice N = 130) (a). Representative Western blots illustrating α1-3 protein expression in α3+/D801Y and WT mice in cortex (CTX), hippocampus (HC), cerebellum (CRBL) and in whole brain lysates (Brain) (full-length Western blots are shown in Supplementary Fig. 1) (b). Relative protein expression levels determined by densitometry showed a significant increase in □1 throughout the brain of α3+/D801Y (N = 4). Expression of α2 was not affected (N = 3) whereas α3 expression was significantly reduced in α3+/D801Y mice (N = 3) (c).

