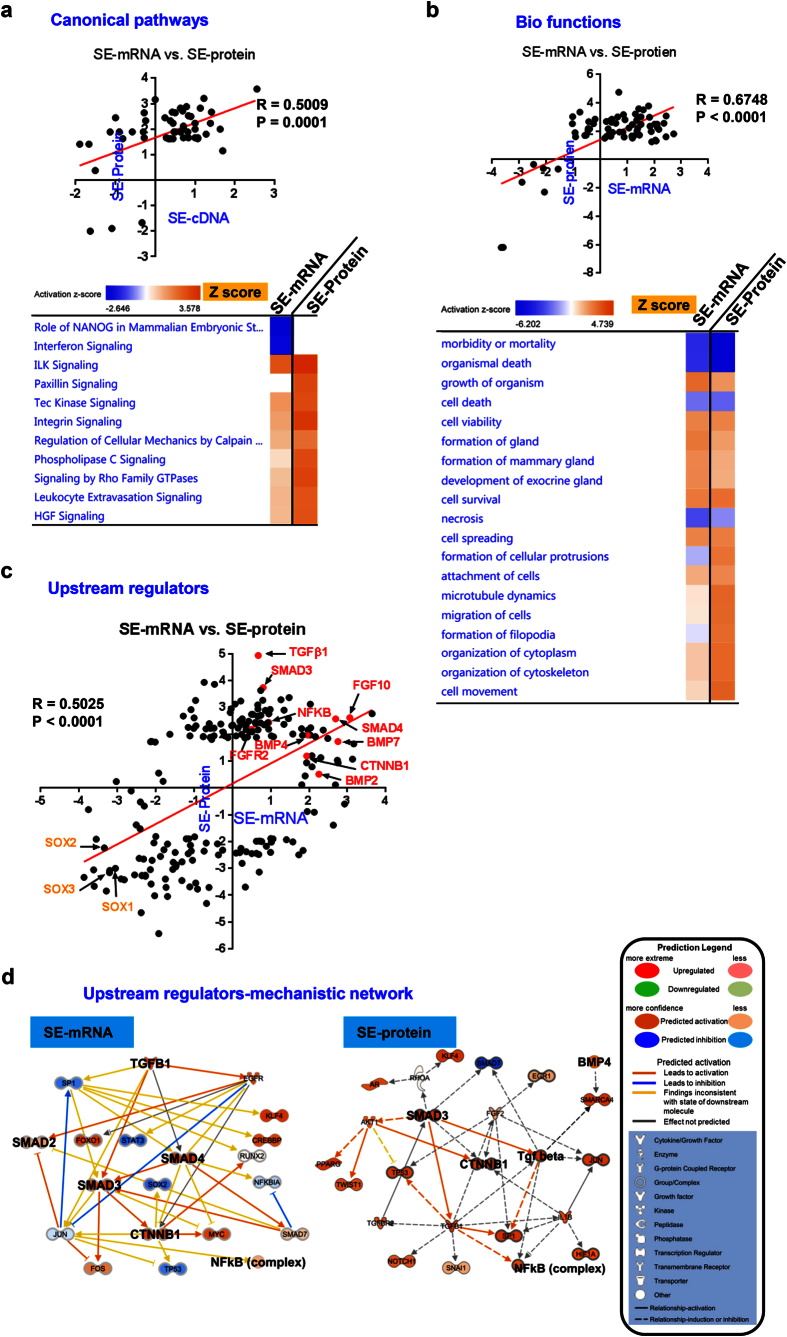
Figure 5. Functional analysis of SE cells using IPA software.
IPA was performed to analyze the SE-mRNA and SE-protein datasets as shown in Fig. 4. (a) Canonical pathway analysis shows most significant up- and down-regulated canonical pathways in SE cells compared to hiPSCs. Pearson’s correlation coefficient (top) and activation z-score (bottom) are shown. (b) Bio function analysis using IPA shows most significant up- and down-regulated bio-functions in SE cells compared to hiPSCs. Pearson’s correlation coefficient (top) and activation z-score (bottom) are shown. (c) Upstream Regulator Analysis in IPA is a tool that predicts upstream regulators from gene expression data based on the literature and compiled in the Ingenuity Knowledge Base. A Fisher’s Exact Test p-value is calculated to assess the significance of enrichment of the gene expression data for the genes downstream of an upstream regulator. X-axis and Y-axis showed the upstream regulators in SE vs. hiPSCs using cDNA microarray (SE-mRNA) and quantitative proteomics (SE-protein) datasets, respectively. Pearson’s correlation coefficient was calculated. (d) Mechanistic network analysis shows the activation of TGFβ superfamily, Wnt/β-catenin, and NF-κB signaling pathways in both cDNA microarray (left) and quantitative proteomics (right) datasets.

