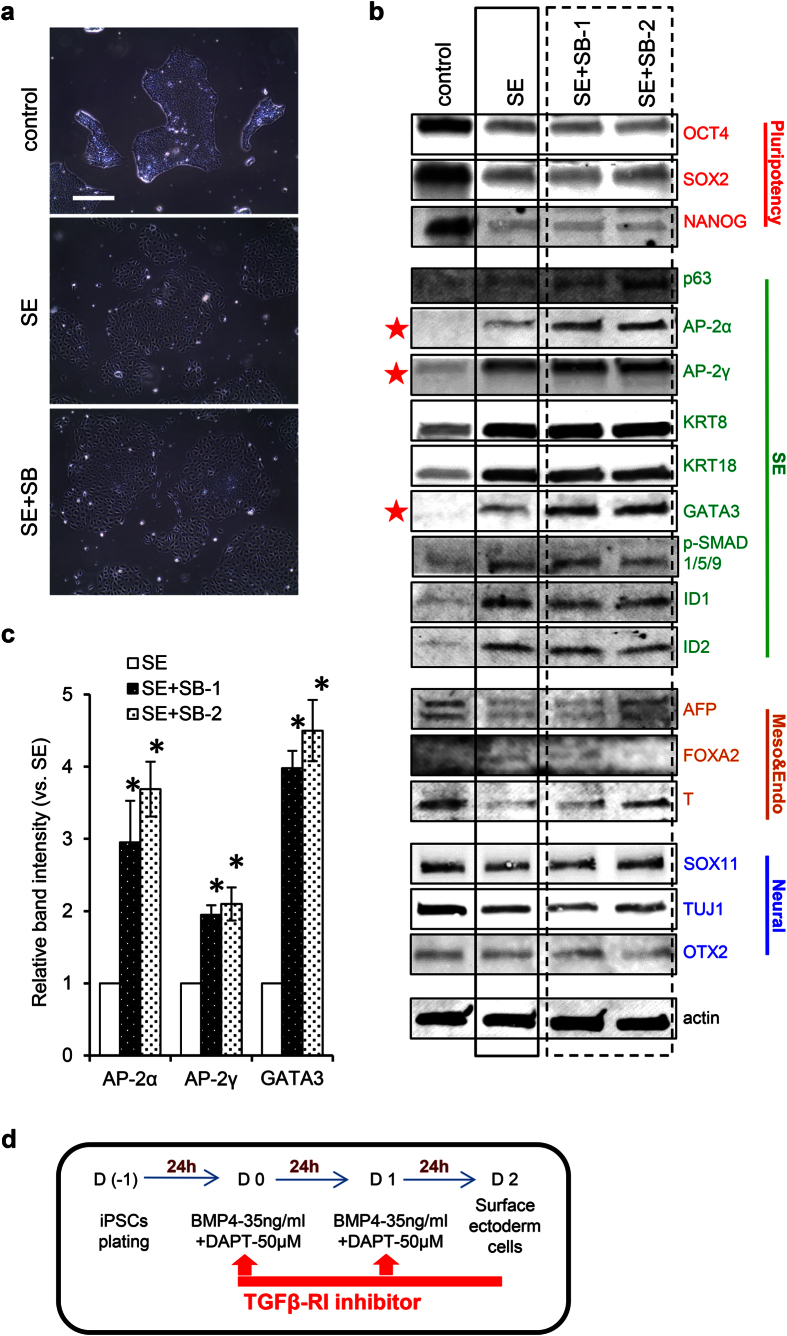
Figure 6. Selective inhibition of TGFβ-RI signaling enhances SE differentiation.
(a) Cell morphologies in hiPSC (control), SE induction (SE, using BMP4 and DAPT), and SE induction with TGFβ-RI inhibitor SB431542 (two separate experiments named as SE + SB-1 and SE + SB-2) groups. Bar: 100 μm. Original magnification x100. (b) Immunoblotting analysis showed the expression of SE and other lineage markers in all groups. Actin was used as loading control. SE + SB-1 and SE + SB-2 suggested two separate experiments. Red stars: greatly altered compared to SE. Black box: results from SE group. Dashed black box: results from SE + SB groups. The gels have been run under the same experimental conditions. Full-length blots are shown in Supplementary Fig. 6. (c) Relative intensity is represented by selected marker expression in SE+SB groups compared to SE only group and plotted. Plotted data represent three independent experiments. *p < 0.05 (relative to SE groups). (d) Modified protocol for in vitro differentiation of hiPSCs to SE. We modified the existing protocol by adding TGFβ-RI signaling inhibitor to improve the SE differentiation.

