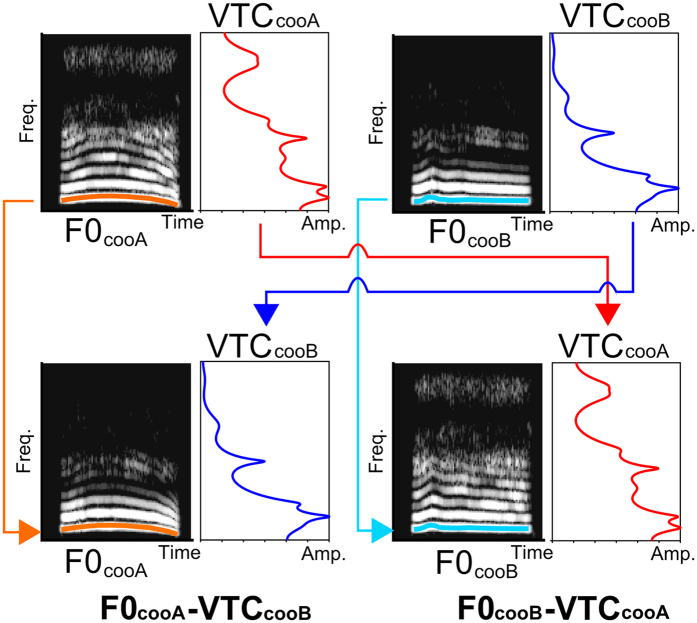
Figure 3. Methods for the synthesis of the stimuli.
The test stimuli were synthesized by combining the F0s and the VTCs from different animals. Orange line: the F0 of Monkey A; light blue line: the F0 of Monkey B. Red line: the linear predictive coding spectrum of Monkey A; blue line: the linear predictive coding spectrum for Monkey B. F0cooA-VTCcooB (bottom left) was synthesized from the F0 of Monkey A (orange) and the VTC of Monkey B (blue), whereas F0cooB-VTCcooA (bottom right) was created from the F0 of Monkey B (light blue) and the VTC of Monkey A (orange).

