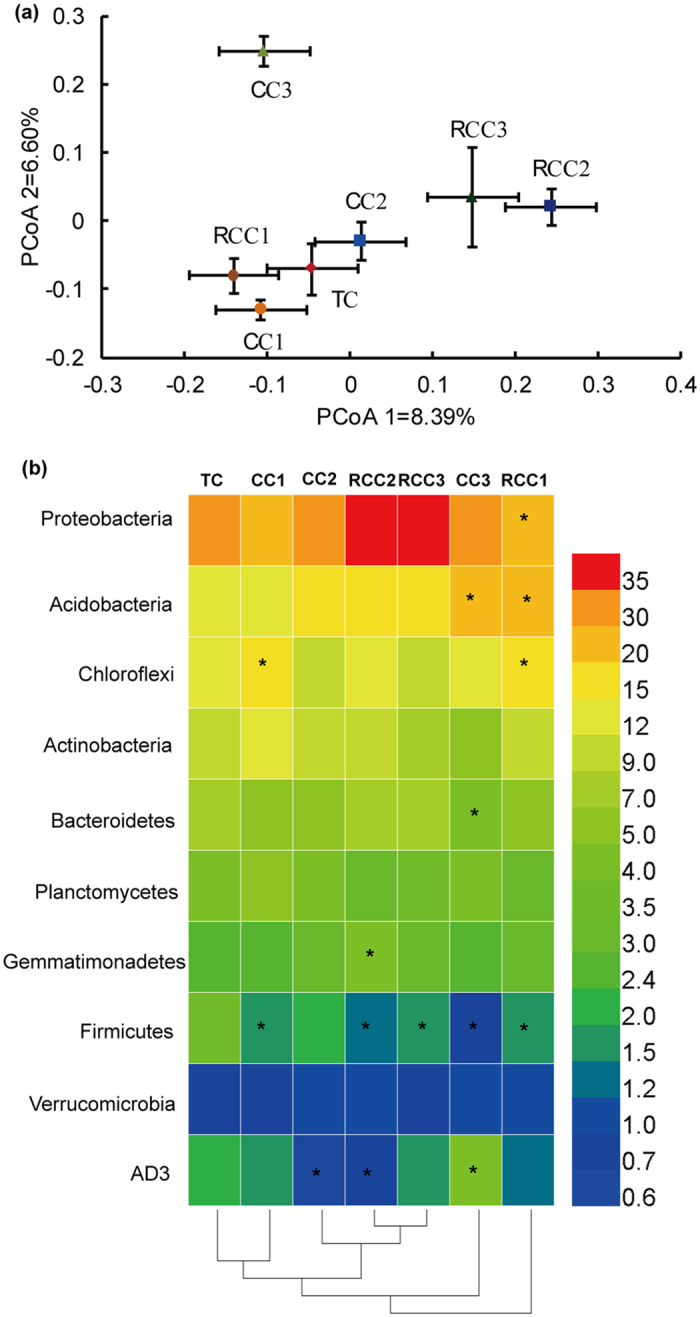
Figure 4. Changes of bacterial communities in notoginseng cropping and traditional cropping soils.

(a) PCoA ordination plots display the relatedness of samples that were separated using Unweighted UniFrac distances of classified 16S rRNA gene sequences. (b) Heat map showing major bacterial phyla with average relative abundance >0.6% in all samples. Clustering on the x-axis is based on bacterial composition of the samples. Data are mean values of n = 3; asterisks denote significant differences between the TC and notoginseng cultivation in the relative abundance of soil bacterial groups at P < 0.05.
