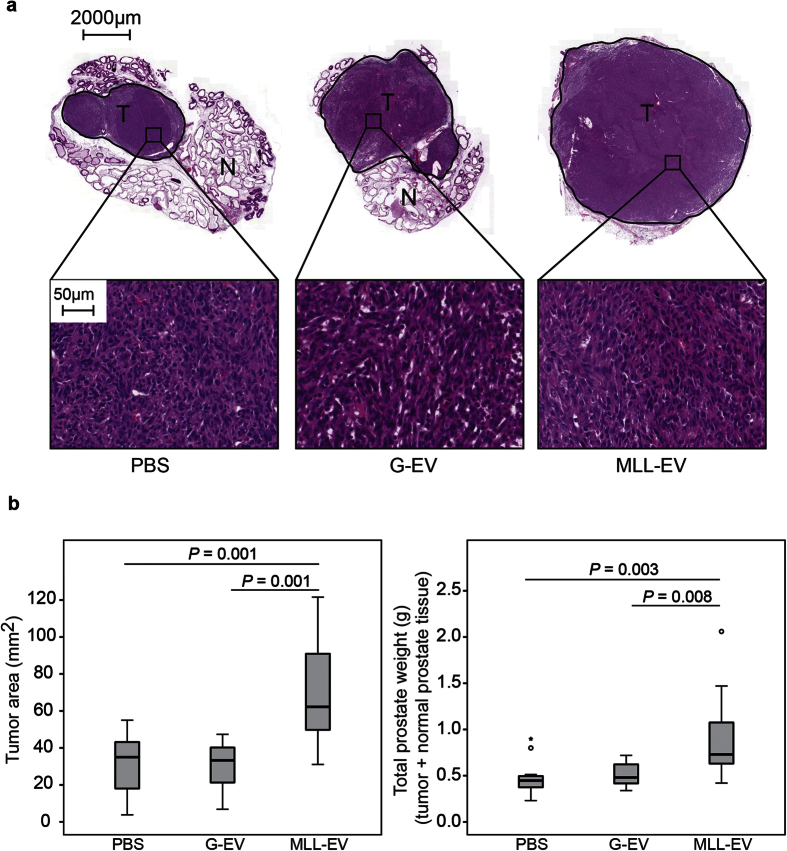
Figure 2. G tumor size.
Rat ventral prostates were injected with MLL-EVs (n = 11), G-EVs (n = 11) or PBS (n = 13) as control and G tumor cells (1 × 10⁵ cells) were injected to the preconditioned prostates 72 hours later. (a) Representative sections of hematoxylin and eosin stained tumors at 8 weeks. T; tumor (encircled in black) and N; normal prostate tissue. Higher magnification shows a similar tumor morphology between the groups. (b) The largest tumor area (mm2) and the total prostate weight (tumor + normal prostate tissue, grams) were analyzed for each tumor at 8 weeks and each group was illustrated with box plots. Outlier values (o) and far-out values (*) are indicated.

