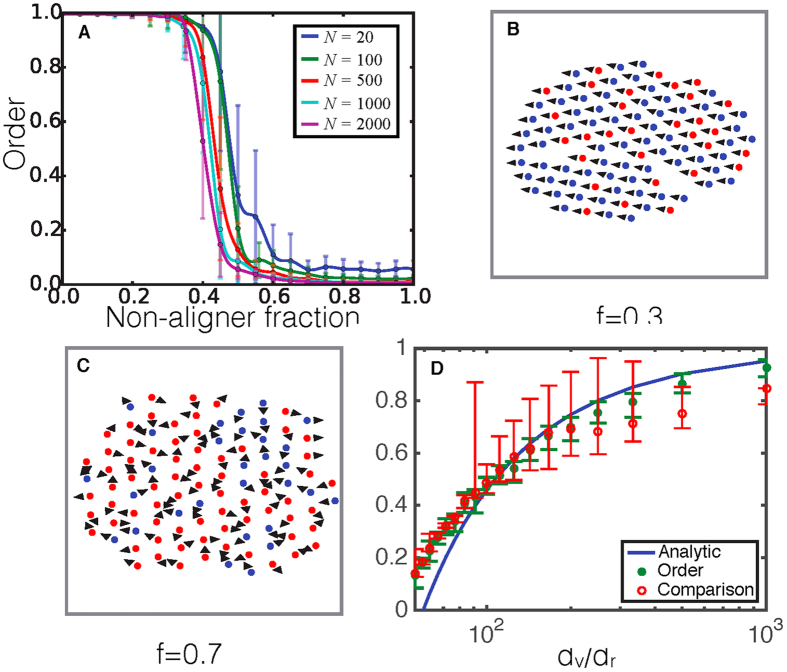
Figure 1.
(a) Order vs non-aligner fraction of swarms with varying system sizes,  = 100. There is a clear transition from an ordered state with
  to a disordered state with low
  at non-aligner fractions above a critical value, f*. (b) Simulation snapshot with a value of f below the critical value, the agents (aligners shown in blue and non-aligners in red) all travel in the same direction (black arrow heads). (c) When the non-aligner fraction is larger than the critical value, the agents try to move in different directions, resulting in a net zero polarization. (d) f* for the order-disorder transition (green) as a function of dv/dr compared to the non-aligner fraction at which the measured average cohesion becomes greater than that of the average alignment (red). The blue curve is the result of our analytical approximation comparing average alignment and cohesiveness.

