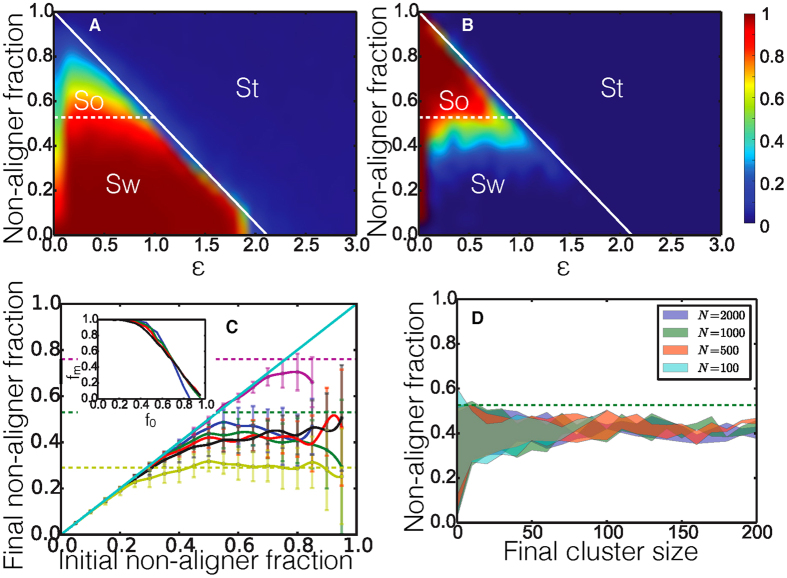
Figure 3.
(A) The order parameter of the system with dv/dr = 100 plotted by color against  and f. (B) The probability of the system fracturing into two or more clusters plotted against
  and f. The three phases, swarming (Sw), sorting (So), and static (St) are labeled on the phase diagram, with the predicted ordering transition (from equation (3)) as a solid white line and the dashed white line corresponding to the critical non-aligner fraction at
  = 1. (C) The non-aligner fraction within small clusters which are ordered in steady state vs. the initial non-aligner fraction f, with N = 100, and
  = 10−0.5,10−1.0,10−1.5, and 10−2.0, corresponding to the blue, green, red, and black curves respectively. The dashed green line shows the value of f* = 0.5 with dv/dr = 100. The purple curve corresponds to f* = 0.8, purple horizontal dashed line, with dv/dr = 200, and
  = 10−1.0. The yellow curve corresponds to f* = 0.2, yellow horizontal dashed line, with dv/dr = 67, and
  = 10−1.0. The light blue line shows the non-aligner fraction in the system if it were unable to fracture. (C inset) The fraction of the system that is in ordered clusters for N = 500. (D) The spread of non-aligner fractions within the sorted swarming clusters for several different systems sizes. The shaded area shown for each system size represents the average ± one standard deviation, for final cluster sizes in bins of size 10. Green dashed line as in (C).

