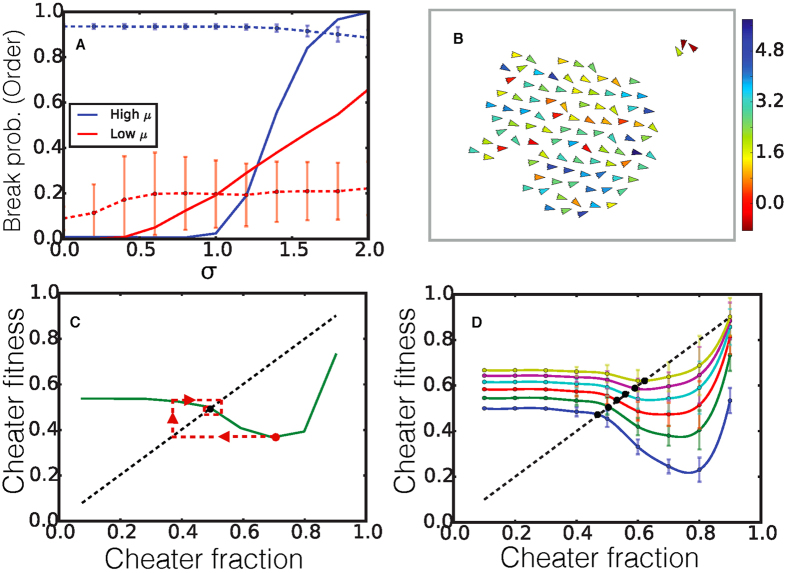
Figure 4.
(A) Probability of fracture (solid), and order parameter (dashed) plotted against σ for a high value of μ = 2.5(blue) and a low value of μ = 0.5(red). (B) Snapshot from a simulation with μ = 2.5, and σ = 1.2 showing fragments of a larger cluster that has sorted itself into an ordered cluster with a higher mean α and static, disordered cluster with α ∼ 0 for most agents. Arrowheads signify direction of motion, and the color bar shows the value of α for each individual agent. (C) The relative fitness of all cheaters,  , as a function of cheater fraction, f for Φ = 0.2. The point where the dashed diagonal line crosses the fitness curve is a fixed point where the cheater fraction and fitness of the system become equal representing an equilibrium fixed point for the evolutionary dynamics. Red dashed line shows an example trajectory an evolving system would follow starting at f = 0.7 and approaching the fixed point after several generations. (D) The relative fitness of all cheaters,
  , in the system as a function of cheater fraction for different values of the ratio of fitness advantage constants
  and 1 corresponding to the blue, green, red, cyan, purple and yellow lines respectively. The points were the dashed diagonal line crosses the fitness curves are evolutionary fixed points. For this system N = 500, dv/dr = 100, and
  = 10−0.5.

