Figure 2.

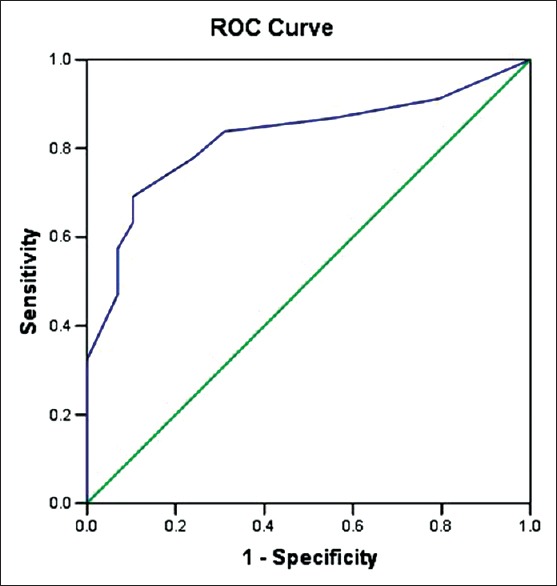
Receiver operating characteristic curve of Glasgow coma scale to test the discrimination of the model (area under the curve = 0.79)

Receiver operating characteristic curve of Glasgow coma scale to test the discrimination of the model (area under the curve = 0.79)