Figure 4.
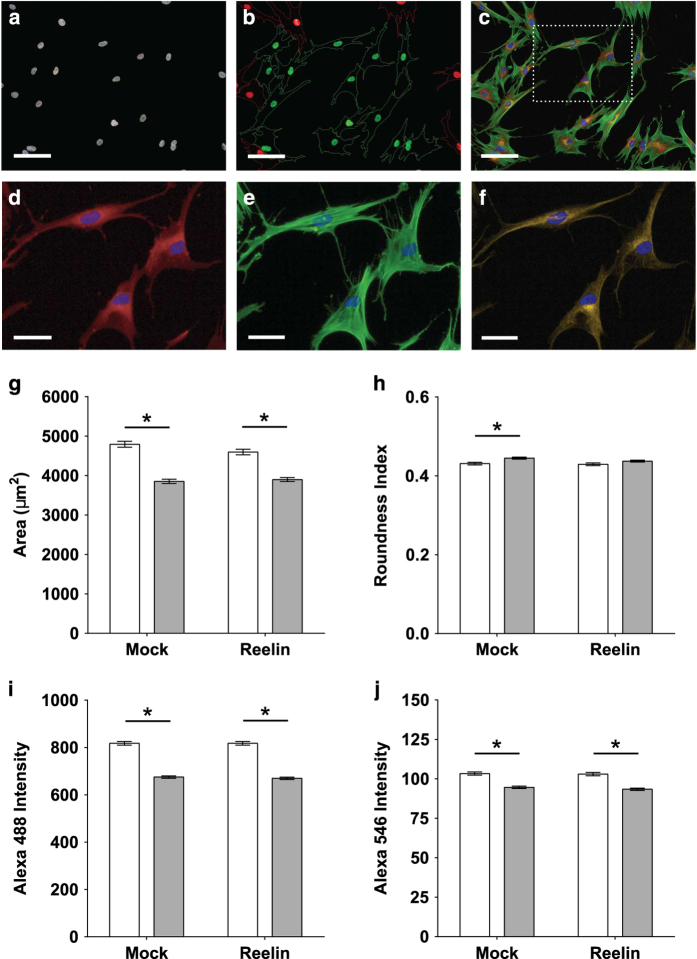
Reelin does not affect cell morphology and cytoskeletal content. Patient and control cells were fixed in 4% paraformaldehyde (PFA) stained for cell nuclei with 4′,6-diamidino-2-phenylindole (DAPI) and cytoplasm with CellMask Deep Red stain. Specific probes were used to visualize cytoskeletal proteins in actin and microtubules. Images were captured on Operetta High Content Imaging System (PerkinElmer, Llantrisant, UK) and analyzed by Harmony software. Age-matched patient cell lines (N=9) were compared with control cell lines (N=9). For all individual cell lines, 120 single cells were quantified and grouped into subsequent disease or non-diseased dataset. (a) “Find nuclei” algorithm was used to locate all cell nuclei stained with DAPI to identify all cells within the imaged field of views. (b) “Select population” algorithm was used to filter for cells that are fully within the field of view (green highlight) and omit cells partially in the field (red highlight). (c) Representative image of cells within a random field of view co-stained with DAPI (blue; nuclei), CellMask (red; cell cytoplasm), Alexa Fluor 488-conjugated phalloidin (green; filamentous actin), and anti-acetylated α-tubulin antibody followed by Alexa Fluor 546 secondary antibody (yellow; stable microtubules). (d) CellMask staining allows measurement of area covered by cell cytoplasm and cell roundness. (e) Filamentous actin expression levels were quantified based on mean fluorescence intensity of Alexa Fluor 488 conjugated to phalloidin within cell cytoplasm stained with CellMask. (f) Microtubule stability was measured based on expression levels of acetylated α-tubulin within cell cytoplasm stained with CellMask. (g) Quantitation of cell area, which correlates to the size of the cell. (h) Cell roundness was quantified as a relative roundness index where an index of “1” represents a perfect circle and “0” represents a straight line. (i) Actin expression graphs measured as Alexa Fluor 488 fluorescence intensities. (j) Stable microtubule expression measured as Alexa Fluor 546 fluorescence intensities. All plotted data represents mean of all cells measured per group±s.e.m. Open bars represent control cell dataset; closed gray bars represent patient cell dataset. Scale bar=50 μm. *P<0.05 based on Tukey’s post-hoc test following two-way ANOVA.

