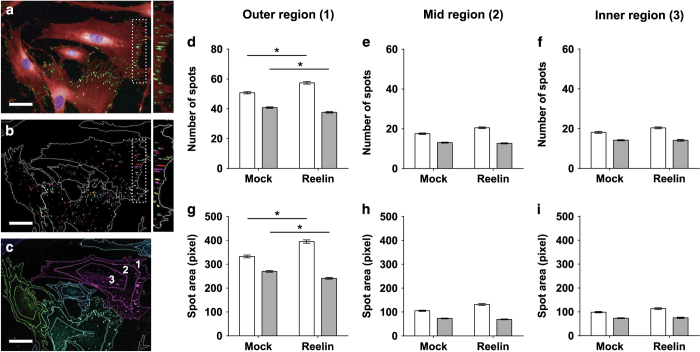
Figure 5.
Patient-derived cells were unable to generate sufficient focal adhesions of the correct size on extracellular reelin. All cells were fixed and stained with primary antibody against phosphorylated FAK at tyrosine-397 (phospho-FAK Y397) followed by fluorophore-conjugated secondary antibody Alexa Fluor 488. Cell nuclei and cytoplasm were stained with DAPI and CellMask Deep Red, respectively. Images were captured on the Operetta High Content Imaging System and analyzed by Harmony software. Age-matched patient cell lines (N=9) were compared with control cell lines (N=9). For all individual cell lines, 300 single cells were quantified and grouped into subsequent disease or non-diseased dataset. (a) Representative immunocytochemical co-staining with multiple probes and markers for cell nuclei (blue), cell cytoplasm (red), and focal adhesions (green spots). Focal adhesion spots were elongated and larger at the cell periphery (insert). (b) Harmony software was used to locate and measure focal adhesion properties. DAPI-stained nuclei were used to locate individual cells within all imaged fields of view. “Find spot” algorithm was used to locate all focal adhesions within the boundaries of the cell determined by CellMask staining that stains for the cell cytoplasm. Harmony software identifies all focal adhesions as spots (insert). (c) Individual cells were divided into three cell regions based on relative distance away from the center of the cell defined by the nuclei stain. Harmony spot analysis generated two key parameter outputs—number of spots (number of focal adhesions; d–f) and spot size (focal adhesion size; g–i). All cells were divided into three regions—outer region (d and g), mid region (e and h) and inner region (f and i). All plotted data represents mean of all cells measured per group±s.e.m. Open bars represent control cell dataset; Closed gray bars represent patient cell dataset. *P<0.05 based on post-hoc Tukey’s test following two-way ANOVA. Scale bar = 50 μm.

