
Fig. 3.
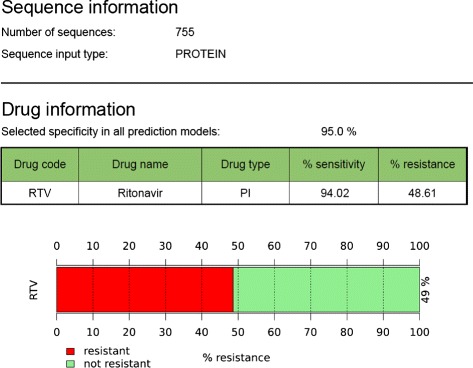
Clinical report: Drug resistance predictions are listed in tabular form and are graphically represented demonstrating the fraction of resistant and susceptible, i.e., non-resistant sequences. Here, prediction results are shown for an example dataset to test resistance against Ritonavir (RTV). 48.61 % of the input protease sequences derived from Sanger sequencing have been predicted to be resistant with a sensitivity of 94.02 %