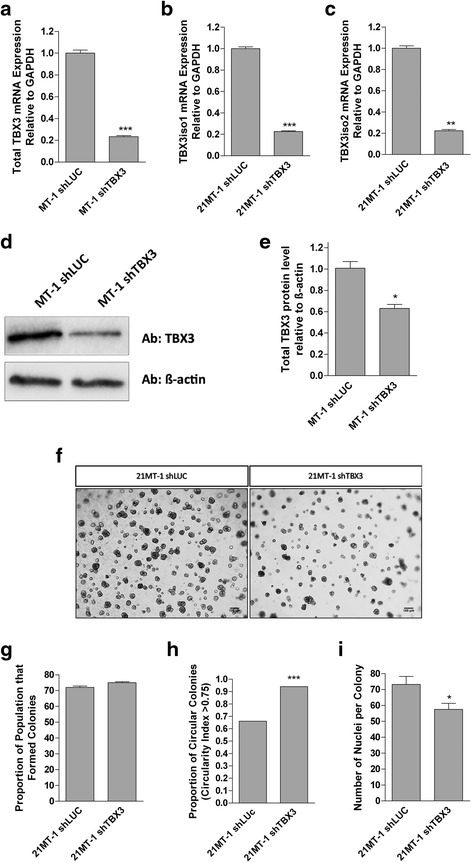
Fig. 5.

TBX3 knockdown results in a less aggressive phenotype of 21MT-1 (IMC) cells in 3D Matrigel. a Total TBX3 mRNA is decreased in 21MT-1 shTBX3 cells after TBX3 knockdown. b TBX3iso1 mRNA is significantly decreased in 21MT-1 shTBX3 after TBX3 knockdown. c TBX3iso2 mRNA is decreased in 21MT-1 after TBX3 knockdown. d Western blot showing total TBX3 protein is decreased in 21MT-1 shTBX3 cells after TBX3 knockdown. e Densitometry quantification of Western blot shows that there is a significant decrease in TBX3 protein expression in the 21MT-1 shTBX3 cells. f Brightfield images showing phenotype of colonies after 9 days in 3D Matrigel. Images were taken at 4X objective. Scale bars represent 100 μm. g, h, i Cells were seeded in Matrigel and grown for 9 days. All of the cell lines were able to form colonies (g), but shTBX3 colonies were rounder (i.e. less dispersed, less invasive) (h) and smaller (i). Means were analyzed using one-way ANOVA followed by Tukey’s post hoc test. The proportion of circular colonies was analyzed using Fisher’s exact test. A value of p < 0.05 was considered statistically significant; *p < 0.05, **p < 0.01, ***p < 0.001. Error bars indicate Standard Error. Results are representative of at least 3 independent experiments
