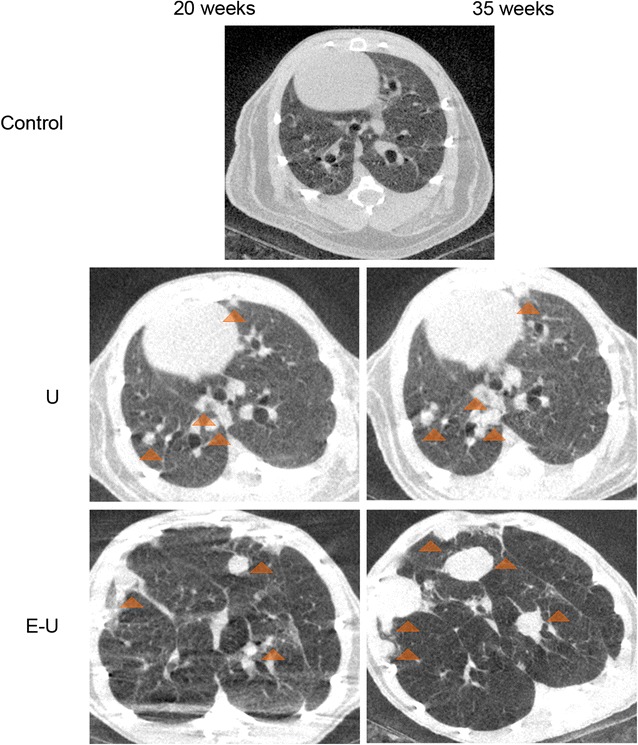
Fig. 3.

Representative images of micro-CT scan analyses in all study groups in the 20- (left panel) and 35-week (right panel) cohorts of mice. Lung nodules (orange triangles) are shown in micro-CT slices of lung parenchyma for U (middle panel) and E–U (bottom panel) groups of mice. E–U elastase–urethane, U urethane
