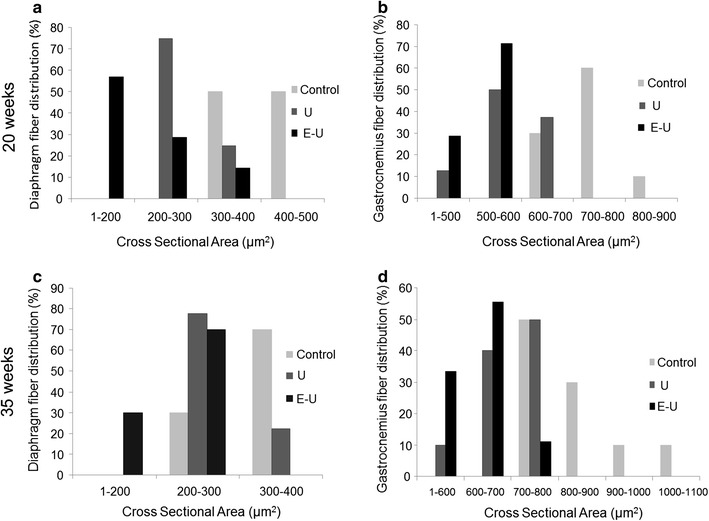
Fig. 6.

Schematic representation of the distribution of the cross-sectional areas of the muscle fibers in the diaphragm and gastrocnemius muscles in both 20- and 35-week time cohorts of animals (a–d, respectively). Values of cross-sectional areas in the control mice are represented in light grey bars, while those detected in U and E–U animals are represented in dark grey and black respectively in all the histograms (a–d)
