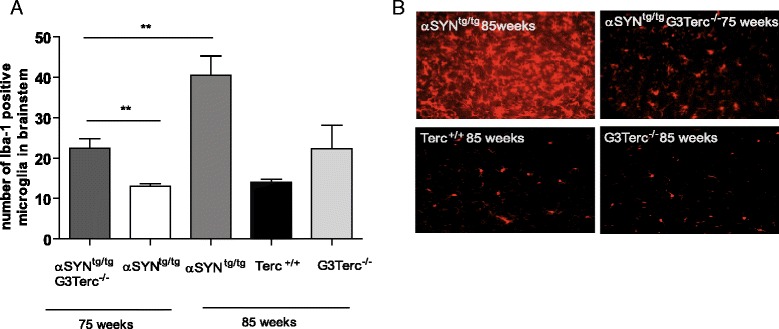
Fig. 3.

Activation of microglia and astrocytes in the brainstem. a The histogram represents the number of Iba-1 positive microglia in the brainstem (n = 5–6 mice per group, ten pictures were counted per mouse). Note that aged-matched αSYNtg/tg G3Terc-/- mice (average 22.47 ± 2.32, n = 6) and αSYNtg/tg mice (average 13.00 ± 0.67, n = 5) show a significant difference in number of microglia (p = 0.0058). b Representative pictures of Iba-1 staining in brainstem
