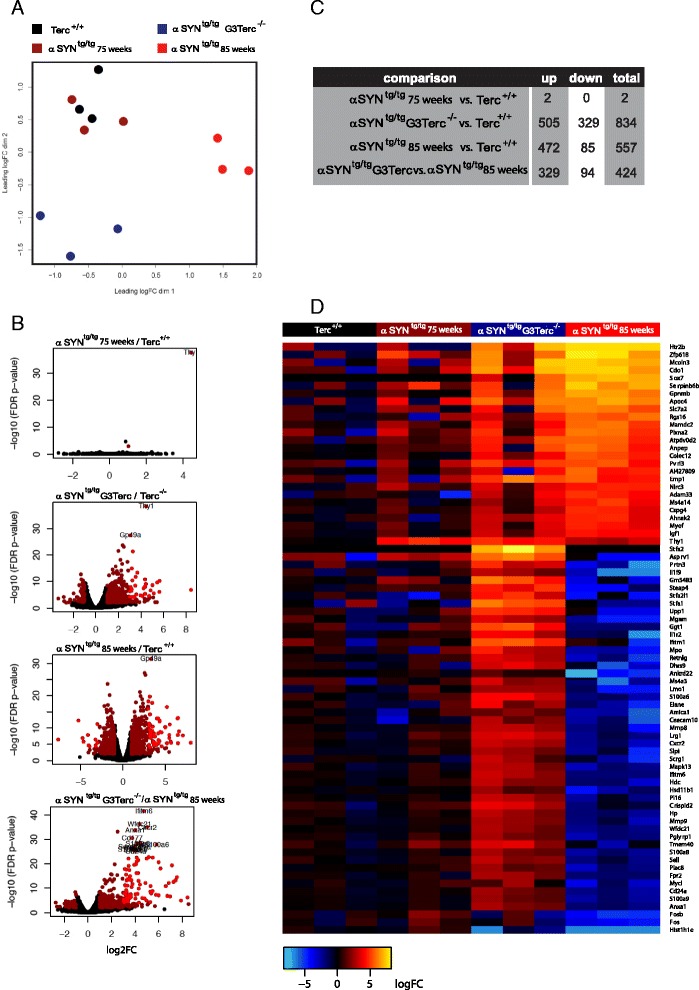
Fig. 6.

RNA sequencing analysis of microglia. a Multidimensional scaling plot of microglia RNAseq data from different mice. αSYNtg/tg microglia from mice with a phenotype cluster separately from all other microglia samples and are most similar to αSYNtg/tg G3Terc-/- microglia. Gene expression in control and αSYNtg/tg microglia without a phenotype are very similar and form a separate, mixed cluster. b Volcano plots showing the significantly differentially expressed genes between pairs of conditions. Dark red dots: FDR <0.05 and logFC >1 and bright red dots: FDR <0.0001 and logFC >3. c The number of differentially expressed genes (up, down and total) between the compared groups. d Heatmap visualization of genes differentially expressed between αSYNtg/tg and αSYNtg/tg G3Terc samples (FDR <0.001, logFC >3)
