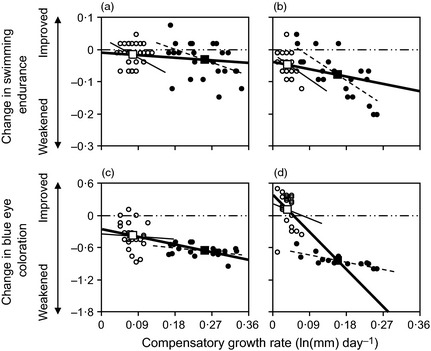
Figure 2.

Age‐related changes in swimming endurance (a and b) and duration of breeding ornamentation (c and d) of three‐spined sticklebacks in relation to their earlier rate of compensatory growth. Zero change is indicated by the double‐dashed line. Individual data points and within‐treatment regression lines are plotted from the Winter (left panels) and Spring (right panels) experiments, categorized by dietary treatment (restricted: black circle and dashed line; control: open circle and thin solid line). Larger square symbols and thicker solid lines denote treatment mean values and between‐treatment regression lines (see van de Pol & Wright 2009 for statistical explanation and Table 2 for full statistical analysis).
