Fig. 7.

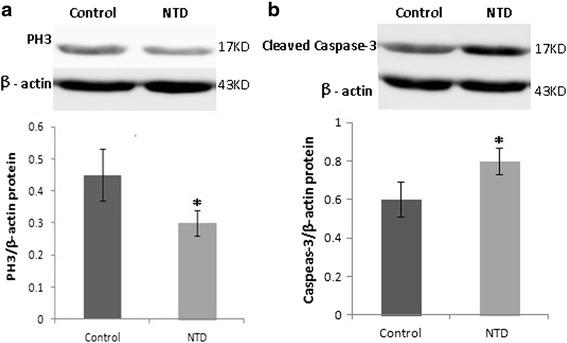
Western blot analysis of PH3 (a) and activated caspase-3 (b) in control and embryos with NTDs in embryonic brain tissue on gestation day 11.5. NTDs, neural tube defects. Date were expressed as meas ± SD (n = 6)

Western blot analysis of PH3 (a) and activated caspase-3 (b) in control and embryos with NTDs in embryonic brain tissue on gestation day 11.5. NTDs, neural tube defects. Date were expressed as meas ± SD (n = 6)