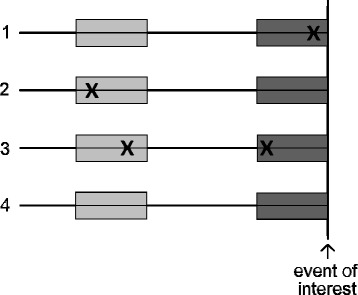
Fig. 1.

Illustration of the timeline of the case-crossover design, shown for four hypothetical subjects with respect to one risk factor. The dark gray area just prior to the event of interest marks the case period, the light gray area marks the reference period. Exposure to the risk factor is marked by “x”. Note that subjects 1 and 2 are discordant (differing exposures between case and reference periods), whereas subjects 3 and 4 are concordant (same exposures in case and reference periods)
