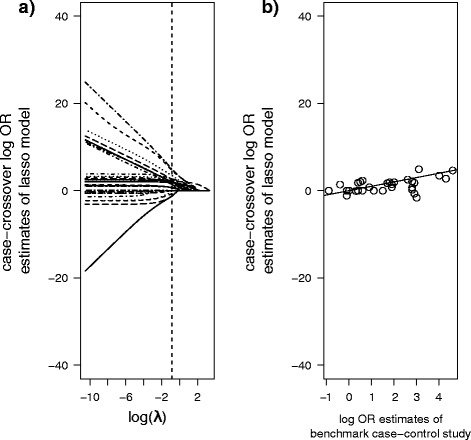
Fig. 4.

a Estimates of the lasso for different values of λ. As λ increases, risk estimates shrink and are eventually 0. The dashed line marks the optimal λ-value and the corresponding optimal estimates, as determined by cross-validation. b Similarly to Fig. 3, the optimal lasso estimates are plotted against the benchmark case–control estimates. Agreement between the two is evidently much better than for multivariable CLR. The line marks the 45-degree line of equality. The y-scale is chosen to accommodate comparisons with Fig. 3
