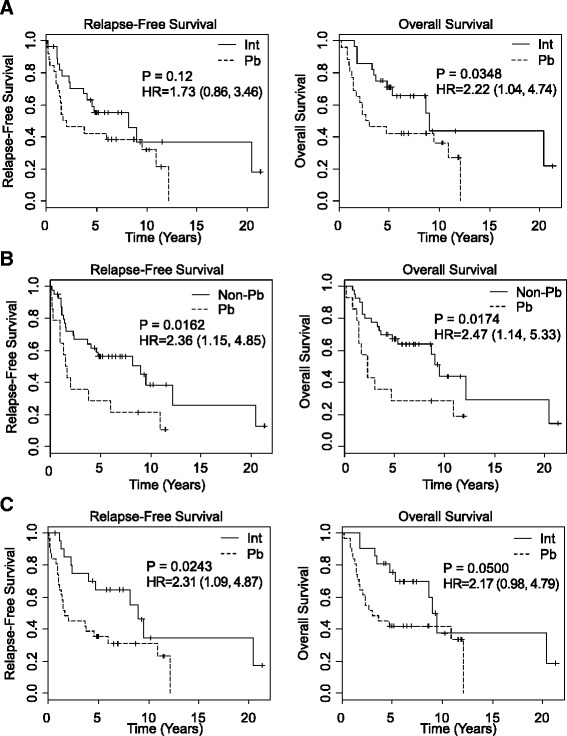
Fig. 2.

Survival analysis of ampullary adenocarcinoma subtypes stratified by different methods. Kaplan-Meier curves for relapse-free survival and overall survival as a function of (a) histological subtype, (b) histomolecular phenotype, and (c) 92-gene classifier. The solid line represents the intestinal (Int) or non-pancreaticobiliary (Non-Pb) subtypes. The dashed line represents the pancreaticobiliary subtype. For the 92-gene classifier, the single gastroesophageal and single lung adenocarcinoma predictions were excluded
