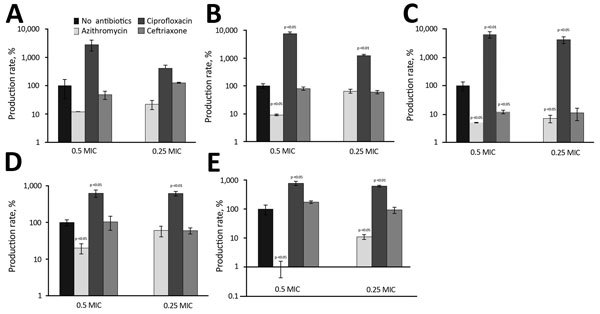
Figure 5.

Relative production rate of Shiga toxin produced in 5 strains of enterohemorrhagic Escherichia coli (4 O80 strains and 1 O157 strain) at subinhibitory concentrations of azithromycin, ciprofloxacin, and ceftriaxone, compared with basal production rate (no antibiotics), France, January 2005–October 2014. A) Isolate 35344. B) Isolate 33115. C) Isolate 35431. D) Isolate 36047. E) Isolate EDL933. Error bars indicate SDs.
