
Figure.
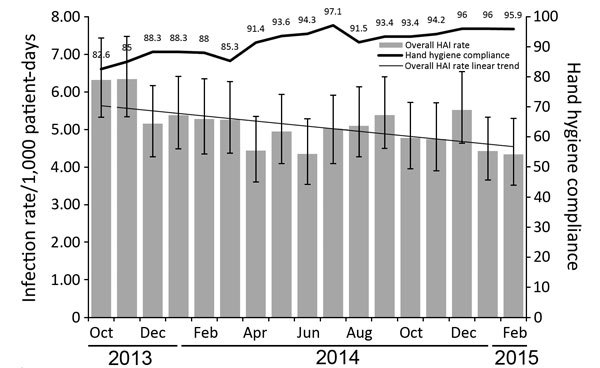
Overall healthcare-associated infection (HAI) rate and hand hygiene compliance by month, October 2013–February 2015. Numbers above data bar indicate monthly compliance percentages. Error bars indicate 95% CIs.
Official websites use .gov
A
.gov website belongs to an official
government organization in the United States.
Secure .gov websites use HTTPS
A lock (
) or https:// means you've safely
connected to the .gov website. Share sensitive
information only on official, secure websites.
Overall healthcare-associated infection (HAI) rate and hand hygiene compliance by month, October 2013–February 2015. Numbers above data bar indicate monthly compliance percentages. Error bars indicate 95% CIs.