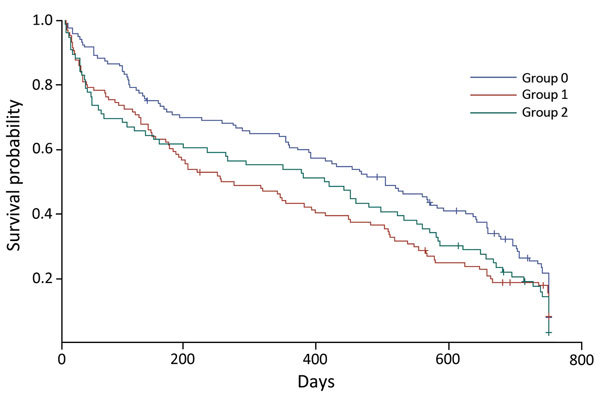
Figure 1.

Kaplan–Meier survival curves of 2-year survival probability (product limit survival estimates) for patients with extensively drug-resistant tuberculosis, KwaZulu-Natal and Eastern Cape Provinces, South Africa, 2006–2010. Group 0, HIV-negative patients; group 1, HIV-positive patients receiving antiretroviral drugs at start of treatment; group 2: HIV-positive patients not receiving antiretroviral drugs at start of treatment. +, censored value.
