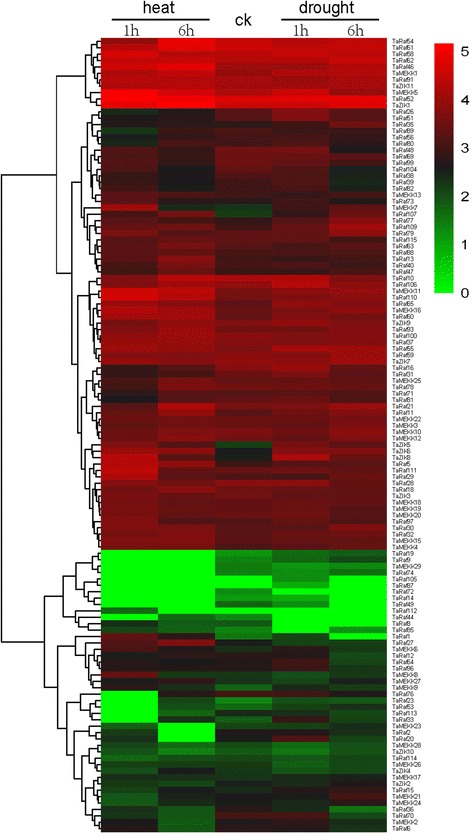
Fig. 9.

Hierarchical clustering of the expression profiles of all TaMAPKKK genes under drought and heat stress treatments. Log10-transformed (FPKM + 1) expression values were used to create the heat map. The red or green colors represent the higher or lower relative abundance of each transcript in each sample. Fold change cutoff of two and p-value < 0.05, q-value < 0.05 were taken as statistically significant
