
Fig. 10.
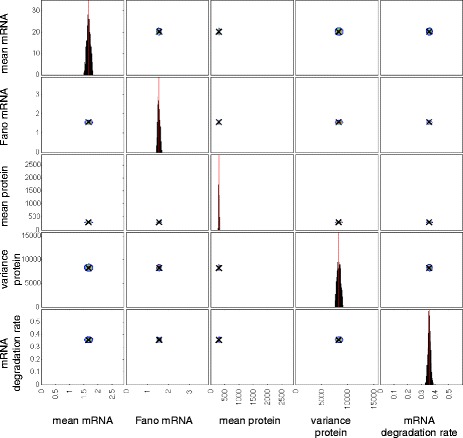
Posterior distribution of summary statistics and the mRNA degradation rate for a test case where synthetic data were generated by simulating from a model with known parameters. Contour plots indicating the density of points with the corresponding summary statistic for each particle in the final population. The summary statistics for each particle are calculated from 1000 simulation runs. The posterior distribution consists of 1000 particles